Biostatistics are the application of statistics to a wide range of topics in biology. It encompasses the design of biological experiments, especially in medicine, pharmacy, agriculture and fishery; the collection, summarization, and analysis of data from those experiments; and the interpretation of, and inference from, the results. A major branch is medical biostatistics, which is exclusively concerned with medicine and health.
In economics, the Gini coefficient, sometimes called Gini index, or Gini ratio, is a measure of statistical dispersion intended to represent the income or wealth distribution of a nation's residents, and is the most commonly used measurement of inequality. It was developed by the Italian statistician and sociologist Corrado Gini and published in his 1912 paper Variability and Mutability.
In statistics, an effect size is a quantitative measure of the magnitude of a phenomenon. Examples of effect sizes are the correlation between two variables, the regression coefficient in a regression, the mean difference, or even the risk with which something happens, such as how many people survive after a heart attack for every one person that does not survive. For most types of effect size, a larger absolute value always indicates a stronger effect, with the main exception being if the effect size is an odds ratio. Effect sizes complement statistical hypothesis testing, and play an important role in power analyses, sample size planning, and in meta-analyses. They are the first item (magnitude) in the MAGIC criteria for evaluating the strength of a statistical claim. Especially in meta-analysis, where the purpose is to combine multiple effect sizes, the standard error (S.E.) of the effect size is of critical importance. The S.E. of the effect size is used to weigh effect sizes when combining studies, so that large studies are considered more important than small studies in the analysis. The S.E. of the effect size is calculated differently for each type of effect size, but generally only requires knowing the study's sample size (N), or the number of observations in each group.
In population genetics, linkage disequilibrium is the non-random association of alleles at different loci in a given population. Loci are said to be in linkage disequilibrium when the frequency of association of their different alleles is higher or lower than what would be expected if the loci were independent and associated randomly.

In statistical modeling, regression analysis is a set of statistical processes for estimating the relationships among variables. It includes many techniques for modeling and analyzing several variables, when the focus is on the relationship between a dependent variable and one or more independent variables. More specifically, regression analysis helps one understand how the typical value of the dependent variable changes when any one of the independent variables is varied, while the other independent variables are held fixed.

In statistics, a bimodal distribution is a continuous probability distribution with two different modes. These appear as distinct peaks in the probability density function, as shown in Figures 1 and 2.
Spatial ecology studies the ultimate distributional or spatial unit occupied by a species. In a particular habitat shared by several species, each of the species is usually confined to its own microhabitat or spatial niche because two species in the same general territory cannot usually occupy the same ecological niche for any significant length of time.
The Rasch model, named after Georg Rasch, is a family of psychometric models for creating measurements from categorical data, such as answers to questions on a reading assessment or questionnaire responses, as a function of the trade-off between (a) the respondent's abilities, attitudes, or personality traits and (b) the item difficulty. For example, they may be used to estimate a student's reading ability or the extremity of a person's attitude to capital punishment from responses on a questionnaire. In addition to psychometrics and educational research, the Rasch model and its extensions are used in other areas, including the health profession and market research because of their general applicability.

Spatial analysis or spatial statistics includes any of the formal techniques which study entities using their topological, geometric, or geographic properties. Spatial analysis includes a variety of techniques, many still in their early development, using different analytic approaches and applied in fields as diverse as astronomy, with its studies of the placement of galaxies in the cosmos, to chip fabrication engineering, with its use of "place and route" algorithms to build complex wiring structures. In a more restricted sense, spatial analysis is the technique applied to structures at the human scale, most notably in the analysis of geographic data.
In statistics, resampling is any of a variety of methods for doing one of the following:
- Estimating the precision of sample statistics by using subsets of available data (jackknifing) or drawing randomly with replacement from a set of data points (bootstrapping)
- Exchanging labels on data points when performing significance tests
- Validating models by using random subsets

In statistics, a Q–Q (quantile-quantile) plot is a probability plot, which is a graphical method for comparing two probability distributions by plotting their quantiles against each other. First, the set of intervals for the quantiles is chosen. A point (x, y) on the plot corresponds to one of the quantiles of the second distribution plotted against the same quantile of the first distribution. Thus the line is a parametric curve with the parameter which is the number of the interval for the quantile.
Fleiss' kappa is a statistical measure for assessing the reliability of agreement between a fixed number of raters when assigning categorical ratings to a number of items or classifying items. This contrasts with other kappas such as Cohen's kappa, which only work when assessing the agreement between not more than two raters or the interrater reliability for one appraiser versus themself. The measure calculates the degree of agreement in classification over that which would be expected by chance.
In statistics, inter-rater reliability is the degree of agreement among raters. It is a score of how much homogeneity, or consensus, there is in the ratings given by various judges. In contrast, intra-rater reliability is a score of the consistency in ratings given by the same person across multiple instances. Inter-rater and intra-rater reliability are aspects of test validity. Assessments of them are useful in refining the tools given to human judges, for example by determining if a particular scale is appropriate for measuring a particular variable. If various raters do not agree, either the scale is defective or the raters need to be re-trained.
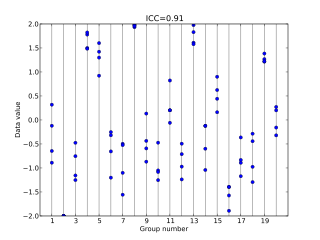
In statistics, the intraclass correlation, or the intraclass correlation coefficient (ICC), is a descriptive statistic that can be used when quantitative measurements are made on units that are organized into groups. It describes how strongly units in the same group resemble each other. While it is viewed as a type of correlation, unlike most other correlation measures it operates on data structured as groups, rather than data structured as paired observations.
Reverberation mapping is an astrophysical technique for measuring the structure of the broad emission-line region (BLR) around a supermassive black hole at the center of an active galaxy, and thus estimating the hole's mass. It is considered a "primary" mass estimation technique, i.e., the mass is measured directly from the motion that its gravitational force induces in the nearby gas.
In probability and statistics, the Tweedie distributions are a family of probability distributions which include the purely continuous normal and gamma distributions, the purely discrete scaled Poisson distribution, and the class of mixed compound Poisson–gamma distributions which have positive mass at zero, but are otherwise continuous. For any random variable Y that obeys a Tweedie distribution, the variance var(Y) relates to the mean E(Y) by the power law,

In statistics, maximum spacing estimation, or maximum product of spacing estimation (MPS), is a method for estimating the parameters of a univariate statistical model. The method requires maximization of the geometric mean of spacings in the data, which are the differences between the values of the cumulative distribution function at neighbouring data points.
Krippendorff's alpha coefficient, named after academic Klaus Krippendorff, is a statistical measure of the agreement achieved when coding a set of units of analysis in terms of the values of a variable. Since the 1970s, alpha is used in content analysis where textual units are categorized by trained readers, in counseling and survey research where experts code open-ended interview data into analyzable terms, in psychological testing where alternative tests of the same phenomena need to be compared, or in observational studies where unstructured happenings are recorded for subsequent analysis.
Bangdiwala's B statistic was created by Dr. Shrikant Bangdiwala in 1985 and is a measure of inter-rater agreement. While not as commonly used as the kappa statistic the B test has been used by various workers. While it is principally used as a graphical aid to inter observer agreement, its asymptotic distribution is known.


