| ||||||||||||||||||||||||||
| ||||||||||||||||||||||||||
County Results
| ||||||||||||||||||||||||||
|
Elections in Arkansas |
---|
The 1908 United States presidential election in Arkansas took place on November 3, 1908. All contemporary 46 states were part of the 1908 United States presidential election. Voters chose nine electors to the Electoral College, which selected the president and vice president.
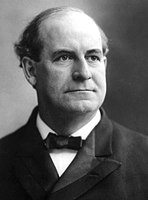
Since 1890, Arkansas had been a classic Jim Crow Southern state in which most blacks and poor whites had been disfranchised by poll taxes. [1] This would confine significant Republican Party politics to the two Unionist Ozark counties of Newton and Searcy that remained controlled by the GOP at a local level throughout the “Solid South” era. [2] Because the coinage of silver had been the dominant political issue apart from black disfranchisement ever since the poll tax was passed, [3] the state would powerfully back “free silver” Democrat William Jennings Bryan in 1896. [4] However, in the following elections disfranchisement affected poor whites more than blacks, with the result that the Republican Party became somewhat more competitive despite being still associated with Reconstruction. [5] Bryan would later win Arkansas again in 1900. The GOP was helped in the earlier 1900s elections by the view that 1904 Democratic nominee Alton B. Parker had betrayed Bryan with his support for the gold standard. [6]
By October polls made it clear that Arkansas would stay firmly with the “Solid South”, [7] and this is what was observed: indeed Bryan improved on Parker's 1904 margin, winning the state against William Howard Taft by a margin of 20.01% (up from Parker's 15.1% in 1904) despite the dislike of Bryan's retreat from free silver.
1908 United States presidential election in Arkansas [8] | |||||
---|---|---|---|---|---|
Party | Candidate | Votes | Percentage | Electoral votes | |
Democratic | William Jennings Bryan | 87,015 | 57.31% | 9 | |
Republican | William Howard Taft | 56,624 | 37.30% | 0 | |
Social Democratic | Eugene V. Debs | 5,842 | 3.85% | 0 | |
Prohibition | Eugene W. Chafin | 1,026 | 0.68% | 0 | |
Populist | Thomas E. Watson | 1,026 | 0.68% | 0 | |
Independence | Thomas L. Hisgen | 289 | 0.19% | 0 | |
Totals | 151,822 | 100.00% | 9 | ||
Voter turnout | 40% |
County | William Jennings Bryan Democratic | William Howard Taft Republican | Eugene Victor Debs Socialist | Various candidates Other parties | Margin | Total votes cast | |||||
---|---|---|---|---|---|---|---|---|---|---|---|
# | % | # | % | # | % | # | % | # | % | ||
Arkansas | 937 | 56.04% | 672 | 40.19% | 42 | 2.51% | 21 | 1.26% | 265 | 15.85% | 1,672 |
Ashley | 1,100 | 55.25% | 821 | 41.24% | 45 | 2.26% | 25 | 1.26% | 279 | 14.01% | 1,991 |
Baxter | 607 | 62.19% | 300 | 30.74% | 64 | 6.56% | 5 | 0.51% | 307 | 31.45% | 976 |
Benton | 3,067 | 63.82% | 1,527 | 31.77% | 155 | 3.23% | 57 | 1.19% | 1,540 | 32.04% | 4,806 |
Boone | 1,149 | 60.25% | 681 | 35.71% | 64 | 3.36% | 13 | 0.68% | 468 | 24.54% | 1,907 |
Bradley | 906 | 71.96% | 316 | 25.10% | 30 | 2.38% | 7 | 0.56% | 590 | 46.86% | 1,259 |
Calhoun | 554 | 69.34% | 234 | 29.29% | 8 | 1.00% | 3 | 0.38% | 320 | 40.05% | 799 |
Carroll | 1,295 | 53.25% | 1,051 | 43.22% | 72 | 2.96% | 14 | 0.58% | 244 | 10.03% | 2,432 |
Chicot | 438 | 40.29% | 644 | 59.25% | 2 | 0.18% | 3 | 0.28% | -206 | -18.95% | 1,087 |
Clark | 1,206 | 52.07% | 1,007 | 43.48% | 27 | 1.17% | 76 | 3.28% | 199 | 8.59% | 2,316 |
Clay | 1,527 | 56.35% | 1,069 | 39.45% | 106 | 3.91% | 8 | 0.30% | 458 | 16.90% | 2,710 |
Cleburne | 506 | 54.47% | 294 | 31.65% | 55 | 5.92% | 74 | 7.97% | 212 | 22.82% | 929 |
Cleveland | 771 | 61.48% | 426 | 33.97% | 39 | 3.11% | 18 | 1.44% | 345 | 27.51% | 1,254 |
Columbia | 1,613 | 65.57% | 817 | 33.21% | 9 | 0.37% | 21 | 0.85% | 796 | 32.36% | 2,460 |
Conway | 2,533 | 74.43% | 818 | 24.04% | 45 | 1.32% | 7 | 0.21% | 1,715 | 50.40% | 3,403 |
Craighead | 1,653 | 64.47% | 711 | 27.73% | 165 | 6.44% | 35 | 1.37% | 942 | 36.74% | 2,564 |
Crawford | 1,261 | 47.07% | 1,339 | 49.98% | 67 | 2.50% | 12 | 0.45% | -78 | -2.91% | 2,679 |
Crittenden | 428 | 52.20% | 382 | 46.59% | 6 | 0.73% | 4 | 0.49% | 46 | 5.61% | 820 |
Cross | 705 | 55.38% | 507 | 39.83% | 59 | 4.63% | 2 | 0.16% | 198 | 15.55% | 1,273 |
Dallas | 721 | 50.17% | 636 | 44.26% | 33 | 2.30% | 47 | 3.27% | 85 | 5.92% | 1,437 |
Desha | 518 | 65.40% | 263 | 33.21% | 6 | 0.76% | 5 | 0.63% | 255 | 32.20% | 792 |
Drew | 1,123 | 60.44% | 679 | 36.54% | 40 | 2.15% | 16 | 0.86% | 444 | 23.90% | 1,858 |
Faulkner | 1,771 | 67.01% | 740 | 28.00% | 93 | 3.52% | 39 | 1.48% | 1,031 | 39.01% | 2,643 |
Franklin | 1,311 | 63.58% | 565 | 27.40% | 119 | 5.77% | 67 | 3.25% | 746 | 36.18% | 2,062 |
Fulton | 741 | 62.69% | 366 | 30.96% | 63 | 5.33% | 12 | 1.02% | 375 | 31.73% | 1,182 |
Garland | 1,340 | 52.04% | 1,105 | 42.91% | 105 | 4.08% | 25 | 0.97% | 235 | 9.13% | 2,575 |
Grant | 524 | 74.64% | 160 | 22.79% | 16 | 2.28% | 2 | 0.28% | 364 | 51.85% | 702 |
Greene | 1,606 | 71.60% | 549 | 24.48% | 82 | 3.66% | 6 | 0.27% | 1,057 | 47.12% | 2,243 |
Hempstead | 1,779 | 55.09% | 1,346 | 41.68% | 27 | 0.84% | 77 | 2.38% | 433 | 13.41% | 3,229 |
Hot Spring | 833 | 53.19% | 686 | 43.81% | 23 | 1.47% | 24 | 1.53% | 147 | 9.39% | 1,566 |
Howard | 967 | 55.86% | 610 | 35.24% | 83 | 4.79% | 71 | 4.10% | 357 | 20.62% | 1,731 |
Independence | 1,529 | 57.61% | 948 | 35.72% | 109 | 4.11% | 68 | 2.56% | 581 | 21.89% | 2,654 |
Izard | 873 | 64.00% | 392 | 28.74% | 53 | 3.89% | 46 | 3.37% | 481 | 35.26% | 1,364 |
Jackson | 1,055 | 51.77% | 864 | 42.39% | 101 | 4.96% | 18 | 0.88% | 191 | 9.37% | 2,038 |
Jefferson | 1,585 | 50.72% | 1,386 | 44.35% | 125 | 4.00% | 29 | 0.93% | 199 | 6.37% | 3,125 |
Johnson | 1,164 | 62.35% | 544 | 29.14% | 140 | 7.50% | 19 | 1.02% | 620 | 33.21% | 1,867 |
Lafayette | 739 | 56.37% | 552 | 42.11% | 4 | 0.31% | 16 | 1.22% | 187 | 14.26% | 1,311 |
Lawrence | 1,188 | 64.78% | 583 | 31.79% | 59 | 3.22% | 4 | 0.22% | 605 | 32.99% | 1,834 |
Lee | 1,182 | 75.33% | 354 | 22.56% | 29 | 1.85% | 4 | 0.25% | 828 | 52.77% | 1,569 |
Lincoln | 389 | 66.95% | 159 | 27.37% | 16 | 2.75% | 17 | 2.93% | 230 | 39.59% | 581 |
Little River | 660 | 53.35% | 435 | 35.17% | 105 | 8.49% | 37 | 2.99% | 225 | 18.19% | 1,237 |
Logan | 1,716 | 57.62% | 1,151 | 38.65% | 88 | 2.96% | 23 | 0.77% | 565 | 18.97% | 2,978 |
Lonoke | 1,385 | 67.33% | 592 | 28.78% | 30 | 1.46% | 50 | 2.43% | 793 | 38.55% | 2,057 |
Madison | 1,441 | 47.01% | 1,541 | 50.28% | 69 | 2.25% | 14 | 0.46% | -100 | -3.26% | 3,065 |
Marion | 705 | 60.83% | 370 | 31.92% | 81 | 6.99% | 3 | 0.26% | 335 | 28.90% | 1,159 |
Miller | 1,035 | 56.19% | 722 | 39.20% | 36 | 1.95% | 49 | 2.66% | 313 | 16.99% | 1,842 |
Mississippi | 930 | 41.10% | 1,167 | 51.57% | 155 | 6.85% | 11 | 0.49% | -237 | -10.47% | 2,263 |
Monroe | 912 | 46.01% | 1,022 | 51.56% | 41 | 2.07% | 7 | 0.35% | -110 | -5.55% | 1,982 |
Montgomery | 553 | 46.59% | 522 | 43.98% | 87 | 7.33% | 25 | 2.11% | 31 | 2.61% | 1,187 |
Nevada | 890 | 45.32% | 784 | 39.92% | 47 | 2.39% | 243 | 12.37% | 106 | 5.40% | 1,964 |
Newton | 377 | 37.74% | 582 | 58.26% | 36 | 3.60% | 4 | 0.40% | -205 | -20.52% | 999 |
Ouachita | 1,166 | 43.20% | 1,505 | 55.76% | 14 | 0.52% | 14 | 0.52% | -339 | -12.56% | 2,699 |
Perry | 608 | 54.14% | 445 | 39.63% | 65 | 5.79% | 5 | 0.45% | 163 | 14.51% | 1,123 |
Phillips | 1,194 | 74.91% | 393 | 24.65% | 3 | 0.19% | 4 | 0.25% | 801 | 50.25% | 1,594 |
Pike | 568 | 47.22% | 601 | 49.96% | 21 | 1.75% | 13 | 1.08% | -33 | -2.74% | 1,203 |
Poinsett | 843 | 64.11% | 462 | 35.13% | 2 | 0.15% | 8 | 0.61% | 381 | 28.97% | 1,315 |
Polk | 824 | 49.70% | 628 | 37.88% | 165 | 9.95% | 41 | 2.47% | 196 | 11.82% | 1,658 |
Pope | 1,664 | 64.75% | 811 | 31.56% | 78 | 3.04% | 17 | 0.66% | 853 | 33.19% | 2,570 |
Prairie | 1,103 | 55.88% | 812 | 41.13% | 41 | 2.08% | 18 | 0.91% | 291 | 14.74% | 1,974 |
Pulaski | 3,893 | 50.33% | 3,533 | 45.68% | 228 | 2.95% | 81 | 1.05% | 360 | 4.65% | 7,735 |
Randolph | 1,348 | 70.35% | 517 | 26.98% | 28 | 1.46% | 23 | 1.20% | 831 | 43.37% | 1,916 |
Saline | 899 | 66.94% | 369 | 27.48% | 53 | 3.95% | 22 | 1.64% | 530 | 39.46% | 1,343 |
Scott | 893 | 55.92% | 481 | 30.12% | 175 | 10.96% | 48 | 3.01% | 412 | 25.80% | 1,597 |
Searcy | 597 | 42.89% | 636 | 45.69% | 141 | 10.13% | 18 | 1.29% | -39 | -2.80% | 1,392 |
Sebastian | 3,035 | 52.90% | 2,050 | 35.73% | 620 | 10.81% | 32 | 0.56% | 985 | 17.17% | 5,737 |
Sevier | 1,073 | 57.75% | 526 | 28.31% | 199 | 10.71% | 60 | 3.23% | 547 | 29.44% | 1,858 |
Sharp | 940 | 69.89% | 317 | 23.57% | 78 | 5.80% | 10 | 0.74% | 623 | 46.32% | 1,345 |
St. Francis | 619 | 41.91% | 755 | 51.12% | 80 | 5.42% | 23 | 1.56% | -136 | -9.21% | 1,477 |
Stone | 496 | 61.92% | 267 | 33.33% | 34 | 4.24% | 4 | 0.50% | 229 | 28.59% | 801 |
Union | 1,407 | 71.60% | 535 | 27.23% | 11 | 0.56% | 12 | 0.61% | 872 | 44.38% | 1,965 |
Van Buren | 797 | 50.64% | 667 | 42.38% | 39 | 2.48% | 71 | 4.51% | 130 | 8.26% | 1,574 |
Washington | 2,748 | 58.36% | 1,704 | 36.19% | 185 | 3.93% | 72 | 1.53% | 1,044 | 22.17% | 4,709 |
White | 1,718 | 57.88% | 887 | 29.89% | 176 | 5.93% | 187 | 6.30% | 831 | 28.00% | 2,968 |
Woodruff | 1,046 | 56.18% | 752 | 40.39% | 51 | 2.74% | 13 | 0.70% | 294 | 15.79% | 1,862 |
Yell | 1,743 | 58.16% | 1,040 | 34.70% | 194 | 6.47% | 20 | 0.67% | 703 | 23.46% | 2,997 |
Totals | 87,020 | 57.31% | 56,684 | 37.33% | 5,842 | 3.85% | 2,299 | 1.51% | 30,336 | 19.98% | 151,845 |
The 1904 United States presidential election in Virginia took place on November 8, 1904, as part of the 1904 United States presidential election. Voters chose 12 representatives, or electors to the Electoral College, who voted for president and vice president.
The 1908 United States presidential election in Virginia took place on November 3, 1908, as part of the 1908 United States presidential election. Voters chose twelve representatives, or electors to the Electoral College, who voted for president and vice president.
The 1920 United States presidential election in Florida, was held on November 2, 1920. Voters chose six representatives, or electors to the Electoral College, who voted for President and Vice-President.
The 1936 United States presidential election in Florida was held on November 8, 1936. Florida voters chose seven electors, or representatives to the Electoral College, who voted for president and vice president.
The 1932 United States presidential election in Florida was held on November 8, 1932, as part of the concurrent United States presidential election held in all 48 contemporary states. Florida voters chose seven electors, or representatives to the Electoral College, who voted for president and vice president.
The 1928 United States presidential election in Florida was held on November 6, 1928, as part of the 1928 United States presidential election held throughout all contemporary forty-eight states. Florida voters chose six electors, or representatives to the Electoral College, who voted for president and vice president.
The 1908 United States presidential election in Florida was held on November 3, 1908 as part of the 1908 United States presidential election. Voters chose five representatives, or electors to the Electoral College, who voted for President and Vice-President. With the disenfranchisement of African-Americans by a poll tax in 1889, Florida become a one-party Democratic state, which it was to remain until the 1950s, apart from the anti-Catholic vote against Al Smith in 1928. Unlike southern states extending into the Appalachian Mountains or Ozarks, or Texas with its German settlements in the Edwards Plateau, Florida completely lacked upland or German refugee whites opposed to secession. Thus Florida's Republican Party between 1872 and 1888 was entirely dependent upon black votes, a fact is graphically seen when one considers that – although very few blacks in Florida had ever voted within the previous fifty-five years – at the time of the landmark court case of Smith v. Allwright, half of Florida's registered Republicans were still black. Thus disfranchisement of blacks and poor whites left Florida as devoid of Republican adherents as Louisiana, Mississippi, or South Carolina.
The 1904 United States presidential election in Florida was held on November 8, 1904. Voter chose five representatives, or electors to the Electoral College, who voted for President and Vice-President.
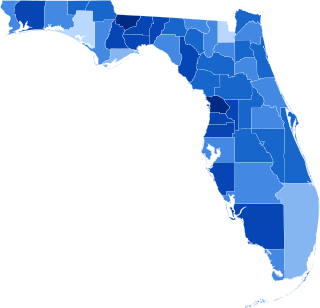
The 1900 United States presidential election in Florida was held on November 6, 1900. Florida voters chose four representatives, or electors to the Electoral College, who voted for President and Vice-President.
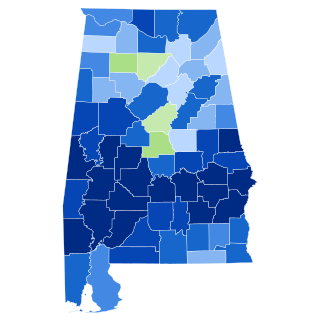
The 1912 United States presidential election in Alabama took place on November 5, 1912, as part of the 1912 United States presidential election. Alabama voters chose twelve representatives, or electors, to the Electoral College, who voted for president and vice president.
The 1908 United States presidential election in Georgia took place on November 3, 1908, as part of the wider United States presidential election. Voters chose 13 representatives, or electors, to the Electoral College, who voted for president and vice president.
The 1900 United States presidential election in Georgia took place on November 6, 1900, as part of the wider United States presidential election. Voters chose 13 representatives, or electors, to the Electoral College, who voted for president and vice president.
The 1896 United States presidential election in Mississippi took place on November 3, 1896. All contemporary 45 states were part of the 1896 United States presidential election. Voters chose nine electors to the Electoral College, which selected the president and vice president.
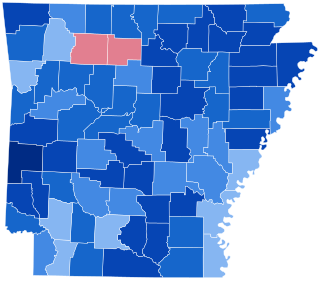
The 1896 United States presidential election in Arkansas took place on November 3, 1896. All contemporary 45 states were part of the 1896 United States presidential election. Voters chose eight electors to the Electoral College, which selected the president and vice president.
The 1900 United States presidential election in Tennessee took place on November 6, 1900. All contemporary 45 states were part of the 1900 United States presidential election. Voters chose 12 electors to the Electoral College, which selected the president and vice president.
The 1908 United States presidential election in Tennessee took place on November 3, 1908. All contemporary 46 states were part of the 1908 United States presidential election. Tennessee voters chose 12 electors to the Electoral College, which selected the president and vice president.
The 1908 United States presidential election in North Carolina took place on November 3, 1908. All contemporary 46 states were part of the 1908 United States presidential election. North Carolina voters chose 12 electors to the Electoral College, which selected the president and vice president.
The 1908 United States presidential election in Oregon took place on November 3, 1908. All contemporary 46 states were part of the 1908 United States presidential election. State voters chose four electors to the Electoral College, which selected the president and vice president.
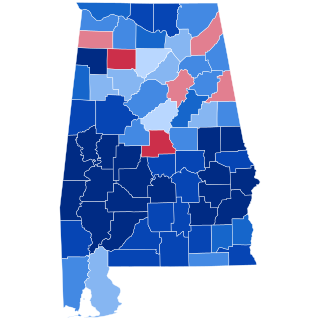
The 1924 United States presidential election in Alabama took place on November 4, 1924, as part of the nationwide presidential election, which was held throughout all contemporary forty-eight states. Voters chose twelve representatives, or electors, to the Electoral College, who voted for president and vice president.
The 1908 United States presidential election in Louisiana took place on November 3, 1908. All contemporary 46 states were part of the 1908 United States presidential election. State voters chose nine electors to the Electoral College, which selected the president and vice president.