
A histogram is an approximate representation of the distribution of numerical data. The term was first introduced by Karl Pearson. To construct a histogram, the first step is to "bin" the range of values— divide the entire range of values into a series of intervals—and then count how many values fall into each interval. The bins are usually specified as consecutive, non-overlapping intervals of a variable. The bins (intervals) must be adjacent and are often of equal size.

In statistics, the Kolmogorov–Smirnov test is a nonparametric test of the equality of continuous, one-dimensional probability distributions that can be used to test whether a sample came from a given reference probability distribution, or to test whether two samples came from the same distribution. Intuitively, the test provides a method to qualitatively answer the question "How likely is it that we would see a collection of samples like this if they were drawn from that probability distribution?" or, in the second case, "How likely is it that we would see two sets of samples like this if they were drawn from the same probability distribution?". It is named after Andrey Kolmogorov and Nikolai Smirnov.
In machine learning, support vector machines are supervised max-margin models with associated learning algorithms that analyze data for classification and regression analysis. Developed at AT&T Bell Laboratories by Vladimir Vapnik with colleagues SVMs are one of the most studied models, being based on statistical learning frameworks or VC theory proposed by Vapnik and Chervonenkis (1974).

In statistics, the logistic model is a statistical model that models the log-odds of an event as a linear combination of one or more independent variables. In regression analysis, logistic regression is estimating the parameters of a logistic model. Formally, in binary logistic regression there is a single binary dependent variable, coded by an indicator variable, where the two values are labeled "0" and "1", while the independent variables can each be a binary variable or a continuous variable. The corresponding probability of the value labeled "1" can vary between 0 and 1, hence the labeling; the function that converts log-odds to probability is the logistic function, hence the name. The unit of measurement for the log-odds scale is called a logit, from logistic unit, hence the alternative names. See § Background and § Definition for formal mathematics, and § Example for a worked example.
In statistics, a mixture model is a probabilistic model for representing the presence of subpopulations within an overall population, without requiring that an observed data set should identify the sub-population to which an individual observation belongs. Formally a mixture model corresponds to the mixture distribution that represents the probability distribution of observations in the overall population. However, while problems associated with "mixture distributions" relate to deriving the properties of the overall population from those of the sub-populations, "mixture models" are used to make statistical inferences about the properties of the sub-populations given only observations on the pooled population, without sub-population identity information.

In statistics, a multimodaldistribution is a probability distribution with more than one mode. These appear as distinct peaks in the probability density function, as shown in Figures 1 and 2. Categorical, continuous, and discrete data can all form multimodal distributions. Among univariate analyses, multimodal distributions are commonly bimodal.

The Kruskal–Wallis test by ranks, Kruskal–Wallis H test, or one-way ANOVA on ranks is a non-parametric method for testing whether samples originate from the same distribution. It is used for comparing two or more independent samples of equal or different sample sizes. It extends the Mann–Whitney U test, which is used for comparing only two groups. The parametric equivalent of the Kruskal–Wallis test is the one-way analysis of variance (ANOVA).
Linear discriminant analysis (LDA), normal discriminant analysis (NDA), or discriminant function analysis is a generalization of Fisher's linear discriminant, a method used in statistics and other fields, to find a linear combination of features that characterizes or separates two or more classes of objects or events. The resulting combination may be used as a linear classifier, or, more commonly, for dimensionality reduction before later classification.
Cohen's kappa coefficient is a statistic that is used to measure inter-rater reliability for qualitative (categorical) items. It is generally thought to be a more robust measure than simple percent agreement calculation, as κ takes into account the possibility of the agreement occurring by chance. There is controversy surrounding Cohen's kappa due to the difficulty in interpreting indices of agreement. Some researchers have suggested that it is conceptually simpler to evaluate disagreement between items.

In statistics, a Q–Q plot (quantile–quantile plot) is a probability plot, a graphical method for comparing two probability distributions by plotting their quantiles against each other. A point (x, y) on the plot corresponds to one of the quantiles of the second distribution (y-coordinate) plotted against the same quantile of the first distribution (x-coordinate). This defines a parametric curve where the parameter is the index of the quantile interval.
Fleiss' kappa is a statistical measure for assessing the reliability of agreement between a fixed number of raters when assigning categorical ratings to a number of items or classifying items. This contrasts with other kappas such as Cohen's kappa, which only work when assessing the agreement between not more than two raters or the intra-rater reliability. The measure calculates the degree of agreement in classification over that which would be expected by chance.
In statistics, inter-rater reliability is the degree of agreement among independent observers who rate, code, or assess the same phenomenon.
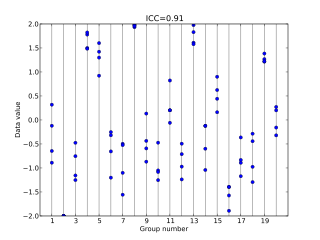
In statistics, the intraclass correlation, or the intraclass correlation coefficient (ICC), is a descriptive statistic that can be used when quantitative measurements are made on units that are organized into groups. It describes how strongly units in the same group resemble each other. While it is viewed as a type of correlation, unlike most other correlation measures, it operates on data structured as groups rather than data structured as paired observations.

In probability theory and statistics, the Conway–Maxwell–Poisson distribution is a discrete probability distribution named after Richard W. Conway, William L. Maxwell, and Siméon Denis Poisson that generalizes the Poisson distribution by adding a parameter to model overdispersion and underdispersion. It is a member of the exponential family, has the Poisson distribution and geometric distribution as special cases and the Bernoulli distribution as a limiting case.
In statistics, multivariate adaptive regression splines (MARS) is a form of regression analysis introduced by Jerome H. Friedman in 1991. It is a non-parametric regression technique and can be seen as an extension of linear models that automatically models nonlinearities and interactions between variables.

A plot is a graphical technique for representing a data set, usually as a graph showing the relationship between two or more variables. The plot can be drawn by hand or by a computer. In the past, sometimes mechanical or electronic plotters were used. Graphs are a visual representation of the relationship between variables, which are very useful for humans who can then quickly derive an understanding which may not have come from lists of values. Given a scale or ruler, graphs can also be used to read off the value of an unknown variable plotted as a function of a known one, but this can also be done with data presented in tabular form. Graphs of functions are used in mathematics, sciences, engineering, technology, finance, and other areas.
Krippendorff's alpha coefficient, named after academic Klaus Krippendorff, is a statistical measure of the agreement achieved when coding a set of units of analysis. Since the 1970s, alpha has been used in content analysis where textual units are categorized by trained readers, in counseling and survey research where experts code open-ended interview data into analyzable terms, in psychological testing where alternative tests of the same phenomena need to be compared, or in observational studies where unstructured happenings are recorded for subsequent analysis.
In statistics, the Jarque–Bera test is a goodness-of-fit test of whether sample data have the skewness and kurtosis matching a normal distribution. The test is named after Carlos Jarque and Anil K. Bera. The test statistic is always nonnegative. If it is far from zero, it signals the data do not have a normal distribution.
Log-linear analysis is a technique used in statistics to examine the relationship between more than two categorical variables. The technique is used for both hypothesis testing and model building. In both these uses, models are tested to find the most parsimonious model that best accounts for the variance in the observed frequencies.
Ordinal data is a categorical, statistical data type where the variables have natural, ordered categories and the distances between the categories are not known. These data exist on an ordinal scale, one of four levels of measurement described by S. S. Stevens in 1946. The ordinal scale is distinguished from the nominal scale by having a ranking. It also differs from the interval scale and ratio scale by not having category widths that represent equal increments of the underlying attribute.


