| Member | Party | Dates | Cong
ress | Electoral history | Counties |
|---|
| District created March 4, 1865 |

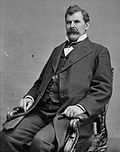
John Bidwell
(Chico) | Republican | March 4, 1865 –
March 3, 1867 | 39th | Elected in 1864.
Retired. | 1865–1885
Butte, Colusa, Del Norte, Humboldt, Lake, Lassen, Marin, Mendocino, Modoc, Napa, Plumas, Shasta, Sierra, Siskiyou, Solano, Sonoma, Sutter, Tehama, Trinity, Yolo, Yuba |

James A. Johnson
(Downieville) | Democratic | March 4, 1867 –
March 3, 1871 | 40th
41st | Elected in 1867.
Re-elected in 1868.
Retired. |

John M. Coghlan
(Suisun City) | Republican | March 4, 1871 –
March 3, 1873 | 42nd | Elected in 1871.
Lost re-election. |
John K. Luttrell
(Santa Rosa) | Democratic | March 4, 1873 –
March 3, 1879 | 43rd
44th
45th | Elected in 1872.
Re-elected in 1875.
Re-elected in 1876.
Retired. |

Campbell P. Berry
(Wheatville) | Democratic | March 4, 1879 –
March 3, 1883 | 46th
47th | Elected in 1879.
Re-elected in 1880.
Retired. |

Barclay Henley
(Santa Rosa) | Democratic | March 4, 1883 –
March 3, 1885 | 48th | Elected in 1882.
Redistricted to the 1st district . |

Joseph McKenna
(Suisun City) | Republican | March 4, 1885 –
March 28, 1892 | 49th
50th
51st
52nd | Elected in 1884.
Re-elected in 1886.
Re-elected in 1888.
Re-elected in 1890.
Resigned to become U.S. Circuit Judge. | 1885–1895
Alameda, Contra Costa, Marin, Sacramento, Solano, Yolo |
| Vacant | March 28, 1892 –
December 5, 1892 | 52nd |

Samuel G. Hilborn
(Oakland) | Republican | December 5, 1892 –
April 4, 1894 | 52nd
53rd | Lost election contest. |

Warren B. English
(Oakland) | Democratic | April 4, 1894 –
March 3, 1895 | 53rd | Won election contest.
Lost re-election. | 1895–1903
Alameda, Colusa, Contra Costa, Glenn, Lake, Solano, Yolo |
Samuel G. Hilborn
(Oakland) | Republican | March 4, 1895 –
March 3, 1899 | 54th
55th | Elected in 1894.
Re-elected in 1896.
Lost renomination. |

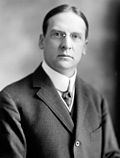
Victor H. Metcalf
(Oakland) | Republican | March 4, 1899 –
July 1, 1904 | 56th
57th
58th | Elected in 1898.
Re-elected in 1900.
Re-elected in 1902.
Resigned to become U.S. Secretary of Commerce and Labor. |
1903–1913
Alameda, Contra Costa, Solano |
| Vacant | July 1, 1904 –
November 8, 1904 | 58th |
Joseph R. Knowland
(Alameda) | Republican | November 8, 1904 –
March 3, 1913 | 58th
59th
60th
61st
62nd | Elected to finish Metcalf's term.
Elected in 1904.
Re-elected in 1906.
Re-elected in 1908.
Re-elected in 1910.
Redistricted to the 6th district . |

Charles F. Curry
(Sacramento) | Republican | March 4, 1913 –
October 10, 1930 | 63rd
64th
65th
66th
67th
68th
69th
70th
71st | Elected in 1912.
Re-elected in 1914.
Re-elected in 1916.
Re-elected in 1918.
Re-elected in 1920.
Re-elected in 1922.
Re-elected in 1924.
Re-elected in 1926.
Re-elected in 1928.
Died in office. | 1913–1933
Contra Costa, Napa, Sacramento, San Joaquin, Solano, Yolo |
| Vacant | October 11, 1930 –
March 3, 1931 | 71st |

Charles F. Curry Jr.
(Sacramento) | Republican | March 4, 1931 –
March 3, 1933 | 72nd | Elected in 1930.
Lost re-election. |

Frank H. Buck
(Vacaville) | Democratic | March 4, 1933 –
September 17, 1942 | 73rd
74th
75th
76th
77th | Elected in 1932.
Re-elected in 1934.
Re-elected in 1936.
Re-elected in 1938.
Re-elected in 1940.
Died in office. | 1933–1953
Napa, Sacramento, San Joaquin, Solano, Yolo |
| Vacant | September 17, 1942 –
January 3, 1943 | 77th |
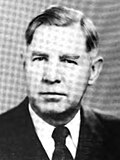
J. Leroy Johnson
(Stockton) | Republican | January 3, 1943 –
January 3, 1953 | 78th
79th
80th
81st
82nd | Elected in 1942.
Re-elected in 1944.
Re-elected in 1946.
Re-elected in 1948.
Re-elected in 1950.
Redistricted to the 11th district . |
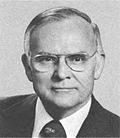
John E. Moss
(Sacramento) | Democratic | January 3, 1953 –
December 31, 1978 | 83rd
84th
85th
86th
87th
88th
89th
90th
91st
92nd
93rd
94th
95th | Elected in 1952.
Re-elected in 1954.
Re-elected in 1956.
Re-elected in 1958.
Re-elected in 1960.
Re-elected in 1962.
Re-elected in 1964.
Re-elected in 1966.
Re-elected in 1968.
Re-elected in 1970.
Re-elected in 1972.
Re-elected in 1974.
Re-elected in 1976.
Retired; resigned before the term ended. | 1953–1963
Colusa, Glenn, Sacramento, Sutter, Yolo, Yuba |
1963–1967
Sacramento |
1967–1975
Sacramento (Sacramento city) |
1975–1983
Eastern two-thirds of Sacramento |
| Vacant | December 31, 1978 –
January 3, 1979 | 95th |

Bob Matsui
(Sacramento) | Democratic | January 3, 1979 –
January 3, 1993 | 96th
97th
98th
99th
100th
101st
102nd | Elected in 1978.
Re-elected in 1980.
Re-elected in 1982.
Re-elected in 1984.
Re-elected in 1986.
Re-elected in 1988.
Re-elected in 1990.
Redistricted to the 5th district . |
1983–1993
Sacramento (Sacramento city and eastern suburbs) |

Vic Fazio
(West Sacramento) | Democratic | January 3, 1993 –
January 3, 1999 | 103rd
104th
105th | Redistricted from the 4th district and re-elected in 1992.
Re-elected in 1994.
Re-elected in 1996.
Retired. | 1993–2003
Southwestern Butte, Colusa, Glenn, northwestern Sacramento, eastern Solano, Sutter, Tehama, Yolo |

Doug Ose
(Sacramento) | Republican | January 3, 1999 –
January 3, 2005 | 106th
107th
108th | Elected in 1998.
Re-elected in 2000.
Re-elected in 2002.
Retired. |
2003–2013

Alpine, Amador, Calaveras, most of suburban Sacramento, northern and eastern Solano |

Dan Lungren
(Gold River) | Republican | January 3, 2005 –
January 3, 2013 | 109th
110th
111th
112th | Elected in 2004.
Re-elected in 2006.
Re-elected in 2008.
Re-elected in 2010.
Redistricted to the 7th district and lost. |

John Garamendi
(Walnut Grove) | Democratic | January 3, 2013 –
January 3, 2023 | 113th
114th
115th
116th
117th | Redistricted from the 10th district and re-elected in 2012.
Re-elected in 2014.
Re-elected in 2016.
Re-elected in 2018.
Re-elected in 2020.
Redistricted to the 8th district . | 2013–2023
North central California including Davis, Fairfield, and Yuba City |
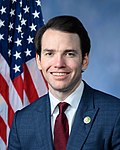
Kevin Kiley
(Roseville) | Republican | January 3, 2023 –
March 9, 2026 | 118th
119th | Elected in 2022.
Re-elected in 2024.
Redistricted to the 6th district. [21] | 2023–present

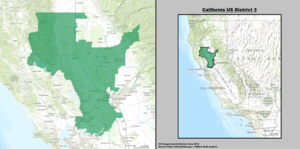
Sierra Nevada region, including all of Alpine, Inyo, Mono, Nevada, Placer, Plumas, and Sierra and parts of El Dorado, Sacramento, and Yuba |
| Independent | March 9, 2026 –
present |


