History
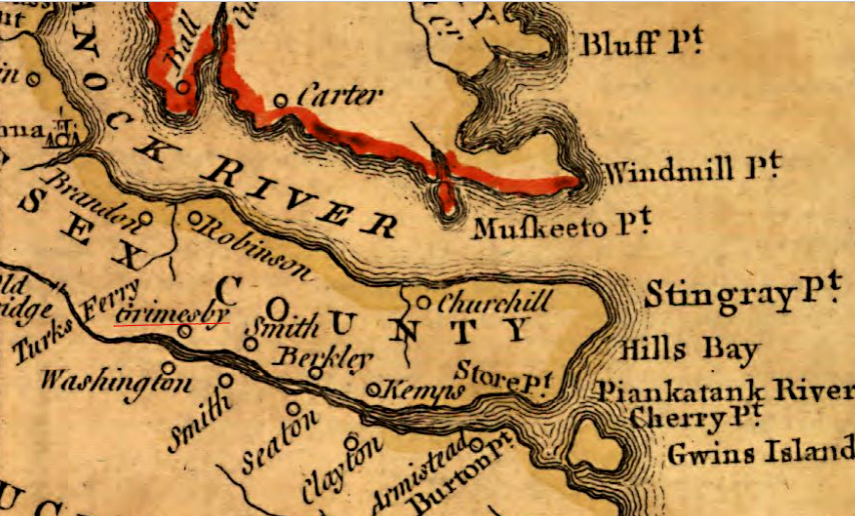
This area was long settled by indigenous peoples; those encountered by Europeans were of the Algonquian-speaking peoples, part of loose alliance of tribes known as the Powhatan Confederacy. The Nimcock had a village on the river where Urbanna was later developed. English settlement of the area began around 1640, with the county being officially formed in 1668 from a part of Lancaster County. [3] This settlement pushed the Nimcock upriver. The county's only incorporated town, Urbanna, was established by the colonial Assembly in 1680 as one of 20 50-acre port towns designated for trade. It served initially as a port on the Rappahannock River for shipping agricultural products, especially the tobacco commodity crop. As the county developed, it became its commercial and governmental center.
The Rosegill Estate was developed as a plantation by Ralph Wormeley beginning in 1649, with construction of its major buildings through the 17th century. It served as the temporary seat of the colony under two royal Governors of Virginia, (Sir Henry Chicheley, who served under Thomas Culpeper, 2nd Baron Culpeper of Thoresway, [4] and Lord Francis Howard, 5th Baron Howard of Effingham). This and other plantations in the county were developed for the commodity crop of tobacco through the 18th century, which was highly dependent on the skilled labor of enslaved African Americans.
In the 19th century, many planters from the Upper South sold slaves to the Deep South after switching from tobacco to mixed crops, which required less labor. Others migrated to the Deep South to develop new land and plantations, taking slaves with them, as did Thomas Wingfield, who moved to Wilkes County, Georgia in 1783, accompanied by 23 slaves. [5] Following the American Civil War and emancipation, numerous freedmen stayed in the rural area of Middlesex County, working on the land for pay or a share of crops. Others moved to towns or cities as artisans, seeking more opportunities.
The Rosegill mansion continues to be used as a private residence to this day. Most of the land of the estate was purchased in the 21st century by a Northern Virginia development firm, which plans to develop it as a 700-home subdivision. An archaeological survey of the property included in the first phase of the planned development has revealed what appear to be parts of the Nimcock village. It also has uncovered evidence of the Rosegill slave community of African Americans. [6] The developer intends to proceed with building houses over a portion of the artifacts, which will render excavation and study of them impossible.
During the American Civil War, Urbanna was planned as the point of landing for General George B. McClellan's 1862 Peninsula Campaign of 1862 to take Richmond. McClellan shifted to use Fort Monroe as the starting point, almost doubling the distance by land that troops had to travel to the Confederate citadel. Delays in reaching the gates of Richmond allowed the Confederates ample time to erect substantial defensive batteries, contributing to the Union failure in this campaign.
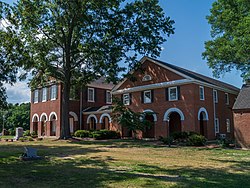
The Historic Middlesex County Courthouse was built in 1850–1874 by architects William R. Jones and John P. Hill. It is listed in the National Register of Historic Places. [7] Construction of a new 21st-century county courthouse [8] began in 2003 and was completed in 2004. It was not occupied until September 2007, however, due to a legal dispute between the county and the architect. The Historic Courthouse has been remodeled and now serves as the Board of Supervisors meeting room and the Registrar's Office. [9]
Urbanna was incorporated on April 2, 1902, comprising an area of 0.49 square miles (1.27 km2). The Town of Urbanna remains the county's largest commercial center and its only incorporated area. The county seat was moved to the Village of Saluda on U.S. Route 17. To the east, almost to Stingray Point, the Village of Deltaville is situated on State Route 33 between the mouths of the Rappahannock and Piankatank rivers. Once a major center for wooden boat building, the village has become known as a commercial and recreational center. Its waterfront and east to Stingray Point how has many marinas, with a concentration on Broad Creek.
Demographics
Historical population| Census | Pop. | Note | %± |
|---|
| 1790 | 4,140 | | — |
|---|
| 1800 | 4,203 | | 1.5% |
|---|
| 1810 | 4,414 | | 5.0% |
|---|
| 1820 | 4,057 | | −8.1% |
|---|
| 1830 | 4,122 | | 1.6% |
|---|
| 1840 | 4,392 | | 6.6% |
|---|
| 1850 | 4,394 | | 0.0% |
|---|
| 1860 | 4,364 | | −0.7% |
|---|
| 1870 | 4,981 | | 14.1% |
|---|
| 1880 | 6,252 | | 25.5% |
|---|
| 1890 | 7,458 | | 19.3% |
|---|
| 1900 | 8,220 | | 10.2% |
|---|
| 1910 | 8,852 | | 7.7% |
|---|
| 1920 | 8,157 | | −7.9% |
|---|
| 1930 | 7,273 | | −10.8% |
|---|
| 1940 | 6,673 | | −8.2% |
|---|
| 1950 | 6,715 | | 0.6% |
|---|
| 1960 | 6,319 | | −5.9% |
|---|
| 1970 | 6,295 | | −0.4% |
|---|
| 1980 | 7,719 | | 22.6% |
|---|
| 1990 | 8,653 | | 12.1% |
|---|
| 2000 | 9,932 | | 14.8% |
|---|
| 2010 | 10,959 | | 10.3% |
|---|
| 2020 | 10,625 | | −3.0% |
|---|
|
Racial and ethnic composition
2020 census
As of the 2020 census, the county had a population of 10,625. The median age was 55.4 years. 15.0% of residents were under the age of 18 and 32.3% of residents were 65 years of age or older. For every 100 females there were 96.0 males, and for every 100 females age 18 and over there were 94.9 males age 18 and over. [17] [18]
The racial makeup of the county was 79.2% White, 14.3% Black or African American, 0.3% American Indian and Alaska Native, 0.3% Asian, 0.0% Native Hawaiian and Pacific Islander, 1.0% from some other race, and 4.9% from two or more races. Hispanic or Latino residents of any race comprised 2.4% of the population. [18]
0.0% of residents lived in urban areas, while 100.0% lived in rural areas. [19]
There were 4,751 households in the county, of which 19.5% had children under the age of 18 living with them and 26.1% had a female householder with no spouse or partner present. About 31.3% of all households were made up of individuals and 18.8% had someone living alone who was 65 years of age or older. [17]
There were 7,100 housing units, of which 33.1% were vacant. Among occupied housing units, 80.5% were owner-occupied and 19.5% were renter-occupied. The homeowner vacancy rate was 3.1% and the rental vacancy rate was 7.0%. [17]
2000 Census
As of the census [20] of 2000, there were 9,932 people, 4,253 households, and 2,913 families residing in the county. The population density was 76 people per square mile (29 people/km2). There were 6,362 housing units at an average density of 49 per square mile (19/km2). The racial makeup of the county was 78.50% White, 20.13% Black or African American, 0.25% Native American, 0.12% Asian, 0.41% from other races, and 0.58% from two or more races. 0.55% of the population were Hispanic or Latino of any race.
There were 4,253 households, out of which 32.40% had children under the age of 18 living with them, 56.10% were married couples living together, 9.50% had a female householder with no husband present, and 31.50% were non-families. 27.10% of all households were made up of individuals, and 14.40% had someone living alone who was 65 years of age or older. The average household size was 2.27 and the average family size was 2.73.
In the county, the population was spread out, with 19.20% under the age of 18, 5.10% from 18 to 24, 22.90% from 25 to 44, 30.30% from 45 to 64, and 22.50% who were 65 years of age or older. The median age was 47 years. For every 100 females there were 92.50 males. For every 100 females age 18 and over, there were 90.50 males.
The median income for a household in the county was $36,875, and the median income for a family was $43,440. Males had a median salary of $30,842 versus $23,659 for females. The per capita income for the county was $22,708. About 9.70% of families and 13.00% of the population were below the poverty line, including 20.70% of those under age 18 and 10.70% of those age 65 or over.
Ethnicity
As of 2016 the largest self-identified ethnic groups/ancestries in Middlesex County are:
- English - 29.9%
- Irish - 14.1%
- German - 11.5%
- American - 10.8%
- French - 3.7% [21]
Education
Middlesex County Schools (MCPS) is the public schools system for Middlesex County, Virginia, United States. [22] The following schools make up the Middlesex County Public Schools system:
Middlesex Elementary (Grades PK - 5th) [23]
St. Clare Walker Middle (Grades 6th - 8th) [24]
Middlesex High School (Grades 9th - 12th) [25]
Another school in Middlesex County is:
Christchurch School (Grades 9th - 12th, private, coed) [26]
This page is based on this
Wikipedia article Text is available under the
CC BY-SA 4.0 license; additional terms may apply.
Images, videos and audio are available under their respective licenses.


