Related Research Articles

In statistics and probability theory, the median is the value separating the higher half from the lower half of a data sample, a population, or a probability distribution. For a data set, it may be thought of as "the middle" value. The basic feature of the median in describing data compared to the mean is that it is not skewed by a small proportion of extremely large or small values, and therefore provides a better representation of the center. Median income, for example, may be a better way to describe center of the income distribution because increases in the largest incomes alone have no effect on median. For this reason, the median is of central importance in robust statistics.

In statistics, the standard deviation is a measure of the amount of variation of a random variable expected about its mean. A low standard deviation indicates that the values tend to be close to the mean of the set, while a high standard deviation indicates that the values are spread out over a wider range.

In probability and statistics, Student's t distribution is a continuous probability distribution that generalizes the standard normal distribution. Like the latter, it is symmetric around zero and bell-shaped.

In statistics, the standard score is the number of standard deviations by which the value of a raw score is above or below the mean value of what is being observed or measured. Raw scores above the mean have positive standard scores, while those below the mean have negative standard scores.

A Z-test is any statistical test for which the distribution of the test statistic under the null hypothesis can be approximated by a normal distribution. Z-test tests the mean of a distribution. For each significance level in the confidence interval, the Z-test has a single critical value which makes it more convenient than the Student's t-test whose critical values are defined by the sample size. Both the Z-test and Student's t-test have similarities in that they both help determine the significance of a set of data. However, the z-test is rarely used in practice because the population deviation is difficult to determine.

In statistics, as opposed to its general use in mathematics, a parameter is any quantity of a statistical population that summarizes or describes an aspect of the population, such as a mean or a standard deviation. If a population exactly follows a known and defined distribution, for example the normal distribution, then a small set of parameters can be measured which completely describes the population, and can be considered to define a probability distribution for the purposes of extracting samples from this population.
In statistics and optimization, errors and residuals are two closely related and easily confused measures of the deviation of an observed value of an element of a statistical sample from its "true value". The error of an observation is the deviation of the observed value from the true value of a quantity of interest. The residual is the difference between the observed value and the estimated value of the quantity of interest. The distinction is most important in regression analysis, where the concepts are sometimes called the regression errors and regression residuals and where they lead to the concept of studentized residuals. In econometrics, "errors" are also called disturbances.
In statistical inference, specifically predictive inference, a prediction interval is an estimate of an interval in which a future observation will fall, with a certain probability, given what has already been observed. Prediction intervals are often used in regression analysis.
The standard error (SE) of a statistic is the standard deviation of its sampling distribution or an estimate of that standard deviation. If the statistic is the sample mean, it is called the standard error of the mean (SEM). The standard error is a key ingredient in producing confidence intervals.
In probability theory and statistics, a scale parameter is a special kind of numerical parameter of a parametric family of probability distributions. The larger the scale parameter, the more spread out the distribution.
In probability theory and statistics, the coefficient of variation (CV), also known as Normalized Root-Mean-Square Deviation (NRMSD), Percent RMS, and relative standard deviation (RSD), is a standardized measure of dispersion of a probability distribution or frequency distribution. It is defined as the ratio of the standard deviation to the mean , and often expressed as a percentage ("%RSD"). The CV or RSD is widely used in analytical chemistry to express the precision and repeatability of an assay. It is also commonly used in fields such as engineering or physics when doing quality assurance studies and ANOVA gauge R&R, by economists and investors in economic models, and in psychology/neuroscience.
This glossary of statistics and probability is a list of definitions of terms and concepts used in the mathematical sciences of statistics and probability, their sub-disciplines, and related fields. For additional related terms, see Glossary of mathematics and Glossary of experimental design.
Robust statistics are statistics which maintain their properties even if the underlying distributional assumptions are incorrect. Robust statistical methods have been developed for many common problems, such as estimating location, scale, and regression parameters. One motivation is to produce statistical methods that are not unduly affected by outliers. Another motivation is to provide methods with good performance when there are small departures from a parametric distribution. For example, robust methods work well for mixtures of two normal distributions with different standard deviations; under this model, non-robust methods like a t-test work poorly.
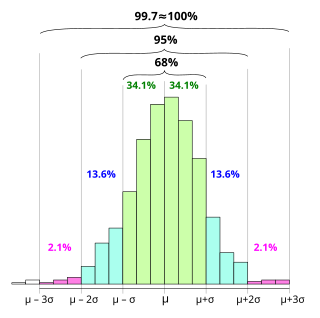
In statistics, the 68–95–99.7 rule, also known as the empirical rule, is a shorthand used to remember the percentage of values that lie within an interval estimate in a normal distribution: 68%, 95%, and 99.7% of the values lie within one, two, and three standard deviations of the mean, respectively.
In statistics, the studentized range, denoted q, is the difference between the largest and smallest data in a sample normalized by the sample standard deviation. It is named after William Sealy Gosset, and was introduced by him in 1927. The concept was later discussed by Newman (1939), Keuls (1952), and John Tukey in some unpublished notes. Its statistical distribution is the studentized range distribution, which is used for multiple comparison procedures, such as the single step procedure Tukey's range test, the Newman–Keuls method, and the Duncan's step down procedure, and establishing confidence intervals that are still valid after data snooping has occurred.

In statistics, an L-estimator is an estimator which is a linear combination of order statistics of the measurements. This can be as little as a single point, as in the median, or as many as all points, as in the mean.
In statistics, a trimmed estimator is an estimator derived from another estimator by excluding some of the extreme values, a process called truncation. This is generally done to obtain a more robust statistic, and the extreme values are considered outliers. Trimmed estimators also often have higher efficiency for mixture distributions and heavy-tailed distributions than the corresponding untrimmed estimator, at the cost of lower efficiency for other distributions, such as the normal distribution.
In statistics, the t-statistic is the ratio of the departure of the estimated value of a parameter from its hypothesized value to its standard error. It is used in hypothesis testing via Student's t-test. The t-statistic is used in a t-test to determine whether to support or reject the null hypothesis. It is very similar to the z-score but with the difference that t-statistic is used when the sample size is small or the population standard deviation is unknown. For example, the t-statistic is used in estimating the population mean from a sampling distribution of sample means if the population standard deviation is unknown. It is also used along with p-value when running hypothesis tests where the p-value tells us what the odds are of the results to have happened.
In statistics, robust measures of scale are methods that quantify the statistical dispersion in a sample of numerical data while resisting outliers. The most common such robust statistics are the interquartile range (IQR) and the median absolute deviation (MAD). These are contrasted with conventional or non-robust measures of scale, such as sample standard deviation, which are greatly influenced by outliers.
In statistics, L-moments are a sequence of statistics used to summarize the shape of a probability distribution. They are linear combinations of order statistics (L-statistics) analogous to conventional moments, and can be used to calculate quantities analogous to standard deviation, skewness and kurtosis, termed the L-scale, L-skewness and L-kurtosis respectively. Standardised L-moments are called L-moment ratios and are analogous to standardized moments. Just as for conventional moments, a theoretical distribution has a set of population L-moments. Sample L-moments can be defined for a sample from the population, and can be used as estimators of the population L-moments.
References
- ↑ Dodge, Y. (2003) The Oxford Dictionary of Statistical Terms, OUP. ISBN 0-19-850994-4
- ↑ Kendall, M.G., Stuart, A. (1973) The Advanced Theory of Statistics. Volume 2: Inference and Relationship, Griffin. ISBN 0-85264-215-6 (Section 20.31–2)
- ↑ Davison, A.C., Hinkley, D.V. (1997) Bootstrap Methods and their Application, CUP. ISBN 0-521-57471-4
| | This statistics-related article is a stub. You can help Wikipedia by expanding it. |