The likelihood function is the joint probability mass of observed data viewed as a function of the parameters of a statistical model. Intuitively, the likelihood function is the probability of observing data assuming is the actual parameter.
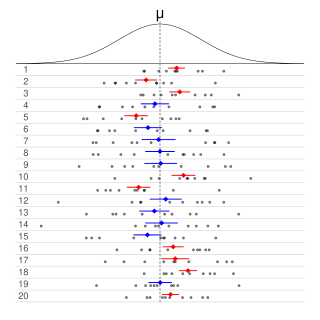
Informally, in frequentist statistics, a confidence interval (CI) is an interval which is expected to typically contain the parameter being estimated. More specifically, given a confidence level , a CI is a random interval which contains the parameter being estimated % of the time. The confidence level, degree of confidence or confidence coefficient represents the long-run proportion of CIs that theoretically contain the true value of the parameter; this is tantamount to the nominal coverage probability. For example, out of all intervals computed at the 95% level, 95% of them should contain the parameter's true value.
In statistical inference, specifically predictive inference, a prediction interval is an estimate of an interval in which a future observation will fall, with a certain probability, given what has already been observed. Prediction intervals are often used in regression analysis.
The doomsday argument (DA), or Carter catastrophe, is a probabilistic argument that claims to predict the future population of the human species based on an estimation of the number of humans born to date. The doomsday argument was originally proposed by the astrophysicist Brandon Carter in 1983, leading to the initial name of the Carter catastrophe. The argument was subsequently championed by the philosopher John A. Leslie and has since been independently conceived by J. Richard Gott and Holger Bech Nielsen. Similar principles of eschatology were proposed earlier by Heinz von Foerster, among others. A more general form was given earlier in the Lindy effect, which proposes that for certain phenomena, the future life expectancy is proportional to the current age and is based on a decreasing mortality rate over time.
A tolerance interval (TI) is a statistical interval within which, with some confidence level, a specified sampled proportion of a population falls. "More specifically, a 100×p%/100×(1−α) tolerance interval provides limits within which at least a certain proportion (p) of the population falls with a given level of confidence (1−α)." "A (p, 1−α) tolerance interval (TI) based on a sample is constructed so that it would include at least a proportion p of the sampled population with confidence 1−α; such a TI is usually referred to as p-content − (1−α) coverage TI." "A (p, 1−α) upper tolerance limit (TL) is simply a 1−α upper confidence limit for the 100 p percentile of the population."
In statistics, a confidence region is a multi-dimensional generalization of a confidence interval. It is a set of points in an n-dimensional space, often represented as an ellipsoid around a point which is an estimated solution to a problem, although other shapes can occur.

In probability theory and statistics, the continuous uniform distributions or rectangular distributions are a family of symmetric probability distributions. Such a distribution describes an experiment where there is an arbitrary outcome that lies between certain bounds. The bounds are defined by the parameters, and which are the minimum and maximum values. The interval can either be closed or open. Therefore, the distribution is often abbreviated where stands for uniform distribution. The difference between the bounds defines the interval length; all intervals of the same length on the distribution's support are equally probable. It is the maximum entropy probability distribution for a random variable under no constraint other than that it is contained in the distribution's support.

In statistics and numerical analysis, isotonic regression or monotonic regression is the technique of fitting a free-form line to a sequence of observations such that the fitted line is non-decreasing everywhere, and lies as close to the observations as possible.

In Bayesian statistics, a credible interval is an interval within which an unobserved parameter value falls with a particular probability. It is an interval in the domain of a posterior probability distribution or a predictive distribution. The generalisation to multivariate problems is the credible region.
In statistics, a binomial proportion confidence interval is a confidence interval for the probability of success calculated from the outcome of a series of success–failure experiments. In other words, a binomial proportion confidence interval is an interval estimate of a success probability when only the number of experiments and the number of successes are known.
Bootstrapping is any test or metric that uses random sampling with replacement, and falls under the broader class of resampling methods. Bootstrapping assigns measures of accuracy to sample estimates. This technique allows estimation of the sampling distribution of almost any statistic using random sampling methods.

In the theory of probability and statistics, the Dvoretzky–Kiefer–Wolfowitz–Massart inequality provides a bound on the worst case distance of an empirically determined distribution function from its associated population distribution function. It is named after Aryeh Dvoretzky, Jack Kiefer, and Jacob Wolfowitz, who in 1956 proved the inequality
Neyman construction, named after Jerzy Neyman, is a frequentist method to construct an interval at a confidence level such that if we repeat the experiment many times the interval will contain the true value of some parameter a fraction of the time.
In statistics, the multiple comparisons, multiplicity or multiple testing problem occurs when one considers a set of statistical inferences simultaneously or estimates a subset of parameters selected based on the observed values.
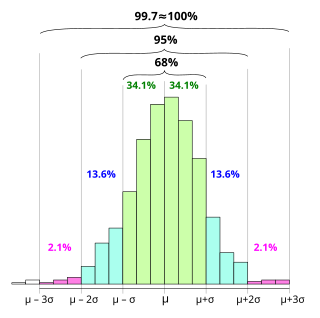
In statistics, the 68–95–99.7 rule, also known as the empirical rule, is a shorthand used to remember the percentage of values that lie within an interval estimate in a normal distribution: 68%, 95%, and 99.7% of the values lie within one, two, and three standard deviations of the mean, respectively.
In statistics, Scheffé's method, named after American statistician Henry Scheffé, is a method for adjusting significance levels in a linear regression analysis to account for multiple comparisons. It is particularly useful in analysis of variance, and in constructing simultaneous confidence bands for regressions involving basis functions.
In particle physics, CLs represents a statistical method for setting upper limits on model parameters, a particular form of interval estimation used for parameters that can take only non-negative values. Although CLs are said to refer to Confidence Levels, "The method's name is ... misleading, as the CLs exclusion region is not a confidence interval." It was first introduced by physicists working at the LEP experiment at CERN and has since been used by many high energy physics experiments. It is a frequentist method in the sense that the properties of the limit are defined by means of error probabilities, however it differs from standard confidence intervals in that the stated confidence level of the interval is not equal to its coverage probability. The reason for this deviation is that standard upper limits based on a most powerful test necessarily produce empty intervals with some fixed probability when the parameter value is zero, and this property is considered undesirable by most physicists and statisticians.
In statistics, cumulative distribution function (CDF)-based nonparametric confidence intervals are a general class of confidence intervals around statistical functionals of a distribution. To calculate these confidence intervals, all that is required is an independently and identically distributed (iid) sample from the distribution and known bounds on the support of the distribution. The latter requirement simply means that all the nonzero probability mass of the distribution must be contained in some known interval .
In statistics, a false coverage rate (FCR) is the average rate of false coverage, i.e. not covering the true parameters, among the selected intervals.
In statistics, particularly regression analysis, the Working–Hotelling procedure, named after Holbrook Working and Harold Hotelling, is a method of simultaneous estimation in linear regression models. One of the first developments in simultaneous inference, it was devised by Working and Hotelling for the simple linear regression model in 1929. It provides a confidence region for multiple mean responses, that is, it gives the upper and lower bounds of more than one value of a dependent variable at several levels of the independent variables at a certain confidence level. The resulting confidence bands are known as the Working–Hotelling–Scheffé confidence bands.


