A descriptive statistic is a summary statistic that quantitatively describes or summarizes features from a collection of information, while descriptive statistics is the process of using and analysing those statistics. Descriptive statistics is distinguished from inferential statistics by its aim to summarize a sample, rather than use the data to learn about the population that the sample of data is thought to represent. This generally means that descriptive statistics, unlike inferential statistics, is not developed on the basis of probability theory, and are frequently nonparametric statistics. Even when a data analysis draws its main conclusions using inferential statistics, descriptive statistics are generally also presented. For example, in papers reporting on human subjects, typically a table is included giving the overall sample size, sample sizes in important subgroups, and demographic or clinical characteristics such as the average age, the proportion of subjects of each sex, the proportion of subjects with related co-morbidities, etc.

In statistics, a power law is a functional relationship between two quantities, where a relative change in one quantity results in a relative change in the other quantity proportional to a power of the change, independent of the initial size of those quantities: one quantity varies as a power of another. For instance, considering the area of a square in terms of the length of its side, if the length is doubled, the area is multiplied by a factor of four. The rate of change exhibited in these relationships is said to be multiplicative.

Statistics is the discipline that concerns the collection, organization, analysis, interpretation, and presentation of data. In applying statistics to a scientific, industrial, or social problem, it is conventional to begin with a statistical population or a statistical model to be studied. Populations can be diverse groups of people or objects such as "all people living in a country" or "every atom composing a crystal". Statistics deals with every aspect of data, including the planning of data collection in terms of the design of surveys and experiments.
Statistical inference is the process of using data analysis to infer properties of an underlying distribution of probability. Inferential statistical analysis infers properties of a population, for example by testing hypotheses and deriving estimates. It is assumed that the observed data set is sampled from a larger population.
In statistics, a population is a set of similar items or events which is of interest for some question or experiment. A statistical population can be a group of existing objects or a hypothetical and potentially infinite group of objects conceived as a generalization from experience. A common aim of statistical analysis is to produce information about some chosen population.

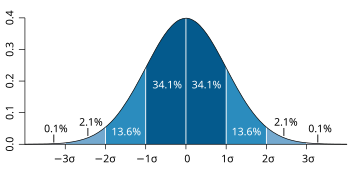
In probability theory and statistics, skewness is a measure of the asymmetry of the probability distribution of a real-valued random variable about its mean. The skewness value can be positive, zero, negative, or undefined.
Nonparametric statistics is the type of statistics that is not restricted by assumptions concerning the nature of the population from which a sample is drawn. This is opposed to parametric statistics, for which a problem is restricted a priori by assumptions concerning the specific distribution of the population and parameters. Nonparametric statistics is based on either not assuming a particular distribution or having a distribution specified but with the distribution's parameters not specified in advance. Nonparametric statistics can be used for descriptive statistics or statistical inference. Nonparametric tests are often used when the assumptions of parametric tests are evidently violated.
In scientific research, the null hypothesis is the claim that no relationship exists between two sets of data or variables being analyzed. The null hypothesis is that any experimentally observed difference is due to chance alone, and an underlying causative relationship does not exist, hence the term "null." In addition to the null hypothesis, an alternative hypothesis is also developed, which claims that a relationship does exist between two variables.
Minimum Description Length (MDL) is a model selection principle where the shortest description of the data is the best model. MDL methods learn through a data compression perspective and are sometimes described as mathematical applications of Occam's razor. The MDL principle can be extended to other forms of inductive inference and learning, for example to estimation and sequential prediction, without explicitly identifying a single model of the data.
In probability and statistics, a mixture distribution is the probability distribution of a random variable that is derived from a collection of other random variables as follows: first, a random variable is selected by chance from the collection according to given probabilities of selection, and then the value of the selected random variable is realized. The underlying random variables may be random real numbers, or they may be random vectors, in which case the mixture distribution is a multivariate distribution.

Mathematical statistics is the application of probability theory, a branch of mathematics, to statistics, as opposed to techniques for collecting statistical data. Specific mathematical techniques which are used for this include mathematical analysis, linear algebra, stochastic analysis, differential equations, and measure theory.

In probability and statistics, the Yule–Simon distribution is a discrete probability distribution named after Udny Yule and Herbert A. Simon. Simon originally called it the Yule distribution.
A test statistic is a statistic used in statistical hypothesis testing. A hypothesis test is typically specified in terms of a test statistic, considered as a numerical summary of a data-set that reduces the data to one value that can be used to perform the hypothesis test. In general, a test statistic is selected or defined in such a way as to quantify, within observed data, behaviours that would distinguish the null from the alternative hypothesis, where such an alternative is prescribed, or that would characterize the null hypothesis if there is no explicitly stated alternative hypothesis.
This glossary of statistics and probability is a list of definitions of terms and concepts used in the mathematical sciences of statistics and probability, their sub-disciplines, and related fields. For additional related terms, see Glossary of mathematics and Glossary of experimental design.
A fat-tailed distribution is a probability distribution that exhibits a large skewness or kurtosis, relative to that of either a normal distribution or an exponential distribution. In common usage, the terms fat-tailed and heavy-tailed are sometimes synonymous; fat-tailed is sometimes also defined as a subset of heavy-tailed. Different research communities favor one or the other largely for historical reasons, and may have differences in the precise definition of either.

A plot is a graphical technique for representing a data set, usually as a graph showing the relationship between two or more variables. The plot can be drawn by hand or by a computer. In the past, sometimes mechanical or electronic plotters were used. Graphs are a visual representation of the relationship between variables, which are very useful for humans who can then quickly derive an understanding which may not have come from lists of values. Given a scale or ruler, graphs can also be used to read off the value of an unknown variable plotted as a function of a known one, but this can also be done with data presented in tabular form. Graphs of functions are used in mathematics, sciences, engineering, technology, finance, and other areas.
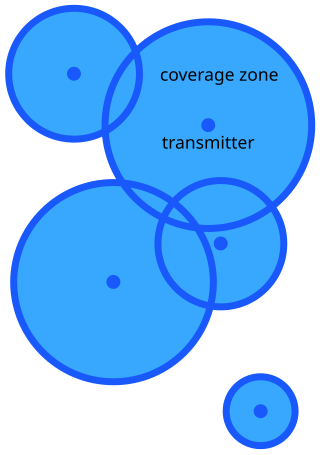
In mathematics, stochastic geometry is the study of random spatial patterns. At the heart of the subject lies the study of random point patterns. This leads to the theory of spatial point processes, hence notions of Palm conditioning, which extend to the more abstract setting of random measures.
Univariate is a term commonly used in statistics to describe a type of data which consists of observations on only a single characteristic or attribute. A simple example of univariate data would be the salaries of workers in industry. Like all the other data, univariate data can be visualized using graphs, images or other analysis tools after the data is measured, collected, reported, and analyzed.