Scree plot

Last updated
A sample scree plot produced in R. The Kaiser criterion is shown in red. Screeplotr.png
A sample scree plot produced in R. The Kaiser criterion is shown in red.

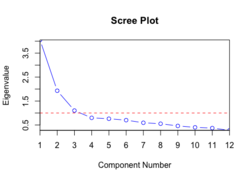
In multivariate statistics, a scree plot is a line plot of the eigenvalues of factors or principal components in an analysis. [1] The scree plot is used to determine the number of factors to retain in an exploratory factor analysis (FA) or principal components to keep in a principal component analysis (PCA). The procedure of finding statistically significant factors or components using a scree plot is also known as a scree test. Raymond B. Cattell introduced the scree plot in 1966. [2]

Contents

A scree plot always displays the eigenvalues in a downward curve, ordering the eigenvalues from largest to smallest. According to the scree test, the "elbow" of the graph where the eigenvalues seem to level off is found and factors or components to the left of this point should be retained as significant. [3]

Etymology

The scree plot is named after the elbow's resemblance to a scree in nature.

Criticism

This test is sometimes criticized for its subjectivity. Scree plots can have multiple "elbows" that make it difficult to know the correct number of factors or components to retain, making the test unreliable. There is also no standard for the scaling of the x and y axes, which means that different statistical programs can produce different plots from the same data. [4]

The test has also been criticized for producing too few factors or components for factor retention.[ clarification needed ] [1]

As the "elbow" point has been defined as point of maximum curvature, as maximum curvature captures the leveling off effect operators use to identify knees, this has led to the creation of a Kneedle algorithm. [5]

See also

Related Research Articles

Multivariate statistics is a subdivision of statistics encompassing the simultaneous observation and analysis of more than one outcome variable, i.e., multivariate random variables. Multivariate statistics concerns understanding the different aims and background of each of the different forms of multivariate analysis, and how they relate to each other. The practical application of multivariate statistics to a particular problem may involve several types of univariate and multivariate analyses in order to understand the relationships between variables and their relevance to the problem being studied.

<span class="mw-page-title-main">Psychological statistics</span>

Psychological statistics is application of formulas, theorems, numbers and laws to psychology. Statistical methods for psychology include development and application statistical theory and methods for modeling psychological data. These methods include psychometrics, factor analysis, experimental designs, and Bayesian statistics. The article also discusses journals in the same field.

<span class="mw-page-title-main">Psychometrics</span> Theory and technique of psychological measurement

Psychometrics is a field of study within psychology concerned with the theory and technique of measurement. Psychometrics generally refers to specialized fields within psychology and education devoted to testing, measurement, assessment, and related activities. Psychometrics is concerned with the objective measurement of latent constructs that cannot be directly observed. Examples of latent constructs include intelligence, introversion, mental disorders, and educational achievement. The levels of individuals on nonobservable latent variables are inferred through mathematical modeling based on what is observed from individuals' responses to items on tests and scales.

<span class="mw-page-title-main">Principal component analysis</span> Method of data analysis

Principal component analysis (PCA) is a popular technique for analyzing large datasets containing a high number of dimensions/features per observation, increasing the interpretability of data while preserving the maximum amount of information, and enabling the visualization of multidimensional data. Formally, PCA is a statistical technique for reducing the dimensionality of a dataset. This is accomplished by linearly transforming the data into a new coordinate system where the variation in the data can be described with fewer dimensions than the initial data. Many studies use the first two principal components in order to plot the data in two dimensions and to visually identify clusters of closely related data points. Principal component analysis has applications in many fields such as population genetics, microbiome studies, and atmospheric science.

Factor analysis is a statistical method used to describe variability among observed, correlated variables in terms of a potentially lower number of unobserved variables called factors. For example, it is possible that variations in six observed variables mainly reflect the variations in two unobserved (underlying) variables. Factor analysis searches for such joint variations in response to unobserved latent variables. The observed variables are modelled as linear combinations of the potential factors plus "error" terms, hence factor analysis can be thought of as a special case of errors-in-variables models.

<span class="mw-page-title-main">Canonical correlation</span> Way of inferring information from cross-covariance matrices

In statistics, canonical-correlation analysis (CCA), also called canonical variates analysis, is a way of inferring information from cross-covariance matrices. If we have two vectors X = (X1, ..., Xn) and Y = (Y1, ..., Ym) of random variables, and there are correlations among the variables, then canonical-correlation analysis will find linear combinations of X and Y which have maximum correlation with each other. T. R. Knapp notes that "virtually all of the commonly encountered parametric tests of significance can be treated as special cases of canonical-correlation analysis, which is the general procedure for investigating the relationships between two sets of variables." The method was first introduced by Harold Hotelling in 1936, although in the context of angles between flats the mathematical concept was published by Jordan in 1875.

<span class="mw-page-title-main">Raymond Cattell</span> British-American psychologist (1905–1998)

Raymond Bernard Cattell was a British-American psychologist, known for his psychometric research into intrapersonal psychological structure. His work also explored the basic dimensions of personality and temperament, the range of cognitive abilities, the dynamic dimensions of motivation and emotion, the clinical dimensions of abnormal personality, patterns of group syntality and social behavior, applications of personality research to psychotherapy and learning theory, predictors of creativity and achievement, and many multivariate research methods including the refinement of factor analytic methods for exploring and measuring these domains. Cattell authored, co-authored, or edited almost 60 scholarly books, more than 500 research articles, and over 30 standardized psychometric tests, questionnaires, and rating scales. According to a widely cited ranking, Cattell was the 16th most eminent, 7th most cited in the scientific journal literature, and among the most productive psychologists of the 20th century. He was a controversial figure due in part to his friendships with, and intellectual respect for, white supremacists and neo-Nazis.

Linear discriminant analysis (LDA), normal discriminant analysis (NDA), or discriminant function analysis is a generalization of Fisher's linear discriminant, a method used in statistics and other fields, to find a linear combination of features that characterizes or separates two or more classes of objects or events. The resulting combination may be used as a linear classifier, or, more commonly, for dimensionality reduction before later classification.

In statistics, canonical analysis (from Ancient Greek: κανων bar, measuring rod, ruler) belongs to the family of regression methods for data analysis. Regression analysis quantifies a relationship between a predictor variable and a criterion variable by the coefficient of correlation r, coefficient of determination r2, and the standard regression coefficient β. Multiple regression analysis expresses a relationship between a set of predictor variables and a single criterion variable by the multiple correlation R, multiple coefficient of determination R2, and a set of standard partial regression weights β1, β2, etc. Canonical variate analysis captures a relationship between a set of predictor variables and a set of criterion variables by the canonical correlations ρ1, ρ2, ..., and by the sets of canonical weights C and D.

This is a bibliography of books by psychologist Raymond Cattell.

Correspondence analysis (CA) is a multivariate statistical technique proposed by Herman Otto Hartley (Hirschfeld) and later developed by Jean-Paul Benzécri. It is conceptually similar to principal component analysis, but applies to categorical rather than continuous data. In a similar manner to principal component analysis, it provides a means of displaying or summarising a set of data in two-dimensional graphical form. Its aim is to display in a biplot any structure hidden in the multivariate setting of the data table. As such it is a technique from the field of multivariate ordination. Since the variant of CA described here can be applied either with a focus on the rows or on the columns it should in fact be called simple (symmetric) correspondence analysis.

<span class="mw-page-title-main">Singular spectrum analysis</span> Nonparametric spectral estimation method

In time series analysis, singular spectrum analysis (SSA) is a nonparametric spectral estimation method. It combines elements of classical time series analysis, multivariate statistics, multivariate geometry, dynamical systems and signal processing. Its roots lie in the classical Karhunen (1946)–Loève spectral decomposition of time series and random fields and in the Mañé (1981)–Takens (1981) embedding theorem. SSA can be an aid in the decomposition of time series into a sum of components, each having a meaningful interpretation. The name "singular spectrum analysis" relates to the spectrum of eigenvalues in a singular value decomposition of a covariance matrix, and not directly to a frequency domain decomposition.

<span class="mw-page-title-main">John L. Horn</span>

John Leonard Horn was a scholar, cognitive psychologist and a pioneer in developing theories of multiple intelligence.

The Sixteen Personality Factor Questionnaire (16PF) is a self-report personality test developed over several decades of empirical research by Raymond B. Cattell, Maurice Tatsuoka and Herbert Eber. The 16PF provides a measure of personality and can also be used by psychologists, and other mental health professionals, as a clinical instrument to help diagnose psychiatric disorders, and help with prognosis and therapy planning. The 16PF can also provide information relevant to the clinical and counseling process, such as an individual's capacity for insight, self-esteem, cognitive style, internalization of standards, openness to change, capacity for empathy, level of interpersonal trust, quality of attachments, interpersonal needs, attitude toward authority, reaction toward dynamics of power, frustration tolerance, and coping style. Thus, the 16PF instrument provides clinicians with a normal-range measurement of anxiety, adjustment, emotional stability and behavioral problems. Clinicians can use 16PF results to identify effective strategies for establishing a working alliance, to develop a therapeutic plan, and to select effective therapeutic interventions or modes of treatment. It can also be used within other areas of psychology, such as career and occupational selection.

Sparse principal component analysis is a specialised technique used in statistical analysis and, in particular, in the analysis of multivariate data sets. It extends the classic method of principal component analysis (PCA) for the reduction of dimensionality of data by introducing sparsity structures to the input variables.

Determining the number of clusters in a data set, a quantity often labelled k as in the k-means algorithm, is a frequent problem in data clustering, and is a distinct issue from the process of actually solving the clustering problem.

<span class="mw-page-title-main">Exploratory factor analysis</span> Statistical method in psychology

In multivariate statistics, exploratory factor analysis (EFA) is a statistical method used to uncover the underlying structure of a relatively large set of variables. EFA is a technique within factor analysis whose overarching goal is to identify the underlying relationships between measured variables. It is commonly used by researchers when developing a scale and serves to identify a set of latent constructs underlying a battery of measured variables. It should be used when the researcher has no a priori hypothesis about factors or patterns of measured variables. Measured variables are any one of several attributes of people that may be observed and measured. Examples of measured variables could be the physical height, weight, and pulse rate of a human being. Usually, researchers would have a large number of measured variables, which are assumed to be related to a smaller number of "unobserved" factors. Researchers must carefully consider the number of measured variables to include in the analysis. EFA procedures are more accurate when each factor is represented by multiple measured variables in the analysis.

The Comrey Personality Scales is a personality test developed by Andrew L. Comrey in 1970. The CPT measures eight main scales and two validity scales. The test is currently distributed by Educational and Industrial Testing Service. The test consists of 180 items rated on a seven point scale.

<span class="mw-page-title-main">Elbow method (clustering)</span> Heuristic used in computer science

In cluster analysis, the elbow method is a heuristic used in determining the number of clusters in a data set. The method consists of plotting the explained variation as a function of the number of clusters and picking the elbow of the curve as the number of clusters to use. The same method can be used to choose the number of parameters in other data-driven models, such as the number of principal components to describe a data set.

Parallel analysis, also known as Horn's parallel analysis, is a statistical method used to determine the number of components to keep in a principal component analysis or factors to keep in an exploratory factor analysis. It is named after psychologist John L. Horn, who created the method, publishing it in the journal Psychometrika in 1965. The method compares the eigenvalues generated from the data matrix to the eigenvalues generated from a Monte-Carlo simulated matrix created from random data of the same size.

References

  1. 1 2 George Thomas Lewith; Wayne B. Jonas; Harald Walach (23 November 2010). Clinical Research in Complementary Therapies: Principles, Problems and Solutions. Elsevier Health Sciences. p. 354. ISBN   978-0-7020-4916-3.
  2. Cattell, Raymond B. (1966). "The Scree Test For The Number Of Factors". Multivariate Behavioral Research. 1 (2): 245–276. doi:10.1207/s15327906mbr0102_10. PMID   26828106.
  3. Alex Dmitrienko; Christy Chuang-Stein; Ralph B. D'Agostino (2007). Pharmaceutical Statistics Using SAS: A Practical Guide. SAS Institute. p. 380. ISBN   978-1-59994-357-2.
  4. Norman, Geoffrey R.; Streiner, David L. (15 September 2007). Biostatistics: The bare essentials. PMPH-USA. p. 201. ISBN   978-1-55009-400-8 via Google Books.
  5. Satopaa, Ville; Albrecht, Jeannie; Irwin, David; Raghavan, Barath (2011-06-20). Finding a "kneedle" in a haystack: Detecting knee points in system behavior. 2011 / 31st International Conference on Distributed Computing Systems. IEEE Workshops. Institute of Electrical and Electronics Engineers. pp. 166–171. doi:10.1109/ICDCSW.2011.20 via IEEE Explore.