| Member | Party | Dates | Cong
ress | Electoral history | Counties |
|---|
| District created March 4, 1873 |

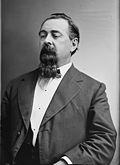
Sherman Otis Houghton
(San Jose) | Republican | March 4, 1873 –
March 3, 1875 | 43rd | Redistricted from the 1st district and re-elected in 1872.
lost re-election. | Fresno, Inyo, Kern, Los Angeles, Mariposa, Merced, Mono, Monterey, San Bernardino, San Diego, San Luis Obispo, San Mateo, Santa Barbara, Santa Clara, Santa Cruz, Stanislaus, Tulare, Ventura |

Peter D. Wigginton
(Merced) | Democratic | March 4, 1875 –
March 3, 1877 | 44th | Elected in 1875.
Retired. |
Romualdo Pacheco
(San Luis Obispo) | Republican | March 4, 1877 –
February 7, 1878 | 45th | Lost contested election. |
Peter D. Wigginton
(Merced) | Democratic | February 7, 1878 –
March 3, 1879 | Won contested election.
Retired. |
Romualdo Pacheco
(San Luis Obispo) | Republican | March 4, 1879 –
March 3, 1883 | 46th
47th | Elected in 1879.
Re-elected in 1880.
Retired. |

Pleasant B. Tully
(Gilroy) | Democratic | March 4, 1883 –
March 3, 1885 | 48th | Elected in 1882.
Retired. | San Francisco |

William W. Morrow
(San Francisco) | Republican | March 4, 1885 –
March 3, 1891 | 49th
50th
51st | Elected in 1884.
Re-elected in 1886.
Re-elected in 1888.
Retired. |

John T. Cutting
(San Francisco) | Republican | March 4, 1891 –
March 3, 1893 | 52nd | Elected in 1890.
Retired. |

James G. Maguire
(San Francisco) | Democratic | March 4, 1893 –
March 3, 1899 | 53rd
54th
55th | Elected in 1892.
Re-elected in 1894.
Re-elected in 1896.
Lost re-election. |

Julius Kahn
(San Francisco) | Republican | March 4, 1899 –
March 3, 1903 | 56th
57th | Elected in 1898.
Re-elected in 1900.
Lost re-election. |

Edward J. Livernash
(San Francisco) | Democratic/
Union Labor | March 4, 1903 –
March 3, 1905 | 58th | Elected in 1902.
Lost re-election. |

Julius Kahn
(San Francisco) | Republican | March 4, 1905 –
December 18, 1924 | 59th
60th
61st
62nd
63rd
64th
65th
66th
67th
68th | Elected in 1904.
Re-elected in 1906.
Re-elected in 1908.
Re-elected in 1910.
Re-elected in 1912.
Re-elected in 1914.
Re-elected in 1916.
Re-elected in 1918.
Re-elected in 1920.
Re-elected in 1922.
Re-elected in 1924.
Died. |
| Vacant | December 18, 1924 –
February 17, 1925 | 68th |

Florence Prag Kahn
(San Francisco) | Republican | February 17, 1925 –
January 3, 1937 | 68th
69th
70th
71st
72nd
73rd
74th | Elected to finish husband's term.
Re-elected in 1926.
Re-elected in 1928.
Re-elected in 1930.
Re-elected in 1932.
Re-elected in 1934.
Lost re-election. |

Franck R. Havenner
(San Francisco) | Progressive | January 3, 1937 –
January 3, 1939 | 75th
76th | Elected in 1936.
Re-elected in 1938.
Lost re-election. |
| Democratic | January 3, 1939 –
January 3, 1941 |

Thomas Rolph
(San Francisco) | Republican | January 3, 1941 –
January 3, 1945 | 77th
78th | Elected in 1940.
Re-elected in 1942.
Lost re-election. |

Franck R. Havenner
(San Francisco) | Democratic | January 3, 1945 –
January 3, 1953 | 79th
80th
81st
82nd | Elected in 1944.
Re-elected in 1946.
Re-elected in 1948.
Re-elected in 1950.
Lost re-election. |

William S. Mailliard
(San Francisco) | Republican | January 3, 1953 –
January 3, 1963 | 83rd
84th
85th
86th
87th | Elected in 1952.
Re-elected in 1954.
Re-elected in 1956.
Re-elected in 1958.
Re-elected in 1960.
Redistricted to the 6th district . |
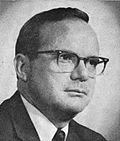
Robert Leggett
(Vallejo) | Democratic | January 3, 1963 –
January 3, 1979 | 88th
89th
90th
91st
92nd
93rd
94th
95th | Elected in 1962.
Re-elected in 1964.
Re-elected in 1966.
Re-elected in 1968.
Re-elected in 1970.
Re-elected in 1972.
Re-elected in 1974.
Re-elected in 1976.
Retired. | 1963–1967
Colusa, Glenn, Lake, Solano, Sutter, Yolo, Yuba |
1967–1973
Colusa, Glenn, Lake, Sacramento (outside the city), Solano, Sutter, Yolo, Yuba |
1973–1975
Colusa, Glenn, Solano, southwestern Sacramento, Sutter, Yolo, Yuba |
1975–1983
Colusa, western Sacramento, Solano, Sutter, Yolo |

Vic Fazio
(West Sacramento) | Democratic | January 3, 1979 –
January 3, 1993 | 96th
97th
98th
99th
100th
101st
102nd | Elected in 1978.
Re-elected in 1980.
Re-elected in 1982.
Re-elected in 1984.
Re-elected in 1986.
Re-elected in 1988.
Re-elected in 1990.
Redistricted to the 3rd district . |
1983–1993
Sacramento (outside the city), Solano, Yolo |

John Doolittle
(Roseville) | Republican | January 3, 1993 –
January 3, 2009 | 103rd
104th
105th
106th
107th
108th
109th
110th | Redistricted from the 14th district and re-elected in 1992.
Re-elected in 1994.
Re-elected in 1996.
Re-elected in 1998.
Re-elected in 2000.
Re-elected in 2002.
Re-elected in 2004.
Re-elected in 2006.
Retired. | 1993–2003
Alpine, Amador, Calaveras, El Dorado, Mono, Placer, northeastern Sacramento, Tuolumne |
2003–2013

Eastern Butte, El Dorado, Lassen, Modoc, Nevada, Placer, Plumas, Sacramento (Orangevale), Sierra |

Tom McClintock
(Elk Grove) | Republican | January 3, 2009 –
January 3, 2023 | 111th
112th
113th
114th
115th
116th
117th | Elected in 2008.
Re-elected in 2010.
Re-elected in 2012.
Re-elected in 2014.
Re-elected in 2016.
Re-elected in 2018.
Re-elected in 2020.
Redistricted to the 3rd district . |
2013–2023
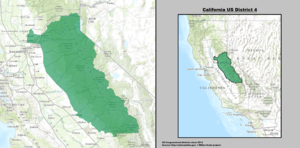
Eastern central California including Lake Tahoe, Roseville, and Yosemite National Park |

Mike Thompson
(St. Helena) | Democratic | January 3, 2023 –
present | 118th
119th | Redistricted from the 5th district and re-elected in 2022.
Re-elected in 2024. | 2023–present

Lake, Napa, most of Yolo, parts of Solano and Sonoma |


