| ||||||||||||||||||||||||||
| ||||||||||||||||||||||||||
| ||||||||||||||||||||||||||
|
Elections in Connecticut |
---|
The 1920 United States presidential election in Connecticut took place on November 2, 1920, as part of the 1920 United States presidential election which was held throughout all contemporary 48 states. Voters chose seven representatives, or electors to the Electoral College, who voted for president and vice president.
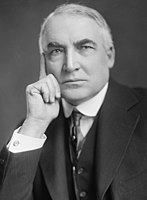
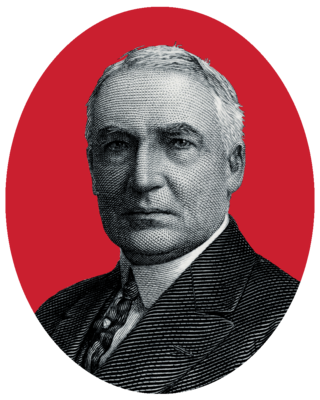
Connecticut voted for Republican nominee, Senator Warren G. Harding of Ohio, over the Democratic nominee, Governor James M. Cox of Ohio. Harding ran with Governor Calvin Coolidge of Massachusetts, while Cox ran with Assistant Secretary of the Navy Franklin D. Roosevelt of New York.
Harding won Connecticut by a margin of 29.69%. His victory in the New England states was helped by the local popularity of his running mate, Calvin Coolidge, a traditional New England Yankee born in the small-town of Plymouth Notch, Vermont, who had started his political career nearby as Governor of Massachusetts.
1920 United States presidential election in Connecticut [1] | ||||||||
---|---|---|---|---|---|---|---|---|
Party | Candidate | Running mate | Popular vote | Electoral vote | ||||
Count | % | Count | % | |||||
Republican | Warren Gamaliel Harding of Ohio | Calvin Coolidge of Massachusetts | 229,238 | 62.72% | 7 | 100.00% | ||
Democratic | James Middleton Cox of Ohio | Franklin Delano Roosevelt of New York | 120,721 | 33.03% | 0 | 0.00% | ||
Socialist | Eugene Victor Debs of Indiana | Seymour Stedman of Illinois | 10,350 | 2.83% | 0 | 0.00% | ||
Farmer–Labor | Parley Parker Christensen of Illinois | Maximillian Sebastian Hayes of Ohio | 1,947 | 0.53% | 0 | 0.00% | ||
Prohibition | Aaron Sherman Watkins of Indiana | David Leigh Colvin of New York | 1,771 | 0.48% | 0 | 0.00% | ||
Socialist Labor | William Wesley Cox of Missouri | August Gillhaus of New York | 1,491 | 0.41% | 0 | 0.00% | ||
Total | 365,513 | 100.00% | 7 | 100.00% |
Town | Warren G. Harding Republican | James M. Cox Democratic | Eugene V. Debs Socialist | Parley P. Christensen Farmer-Labor | Aaron Watkins Prohibition | William W. Cox Socialist Labor | Margin | Total votes cast [2] | |||||||
---|---|---|---|---|---|---|---|---|---|---|---|---|---|---|---|
# | % | # | % | # | % | # | % | # | % | # | % | # | % | ||
Andover | 107 | 68.59% | 47 | 30.13% | 0 | 0.00% | 0 | 0.00% | 2 | 1.28% | 0 | 0.00% | 60 | 38.46% | 156 |
Ansonia | 3,115 | 57.06% | 2,150 | 39.38% | 151 | 2.77% | 17 | 0.31% | 11 | 0.20% | 15 | 0.27% | 965 | 17.68% | 5,459 |
Ashford | 103 | 52.82% | 84 | 43.08% | 1 | 0.51% | 1 | 0.51% | 6 | 3.08% | 0 | 0.00% | 19 | 9.74% | 195 |
Avon | 263 | 68.31% | 119 | 30.91% | 0 | 0.00% | 0 | 0.00% | 2 | 0.52% | 1 | 0.26% | 144 | 37.40% | 385 |
Barkhamsted | 168 | 75.34% | 47 | 21.08% | 3 | 1.35% | 1 | 0.45% | 4 | 1.79% | 0 | 0.00% | 121 | 54.26% | 223 |
Beacon Falls | 175 | 70.85% | 63 | 25.51% | 8 | 3.24% | 0 | 0.00% | 1 | 0.40% | 0 | 0.00% | 112 | 45.34% | 247 |
Berlin | 738 | 69.62% | 284 | 26.79% | 20 | 1.89% | 6 | 0.57% | 10 | 0.94% | 2 | 0.19% | 454 | 42.83% | 1,060 |
Bethany | 70 | 57.38% | 50 | 40.98% | 1 | 0.82% | 0 | 0.00% | 1 | 0.82% | 0 | 0.00% | 20 | 16.39% | 122 |
Bethel | 904 | 68.38% | 397 | 30.03% | 10 | 0.76% | 4 | 0.30% | 6 | 0.45% | 1 | 0.08% | 507 | 38.35% | 1,322 |
Bethlehem | 113 | 66.86% | 55 | 32.54% | 0 | 0.00% | 0 | 0.00% | 1 | 0.59% | 0 | 0.00% | 58 | 34.32% | 169 |
Bloomfield | 425 | 62.87% | 225 | 33.28% | 21 | 3.11% | 4 | 0.59% | 0 | 0.00% | 1 | 0.15% | 200 | 29.59% | 676 |
Bolton | 78 | 54.17% | 63 | 43.75% | 1 | 0.69% | 1 | 0.69% | 1 | 0.69% | 0 | 0.00% | 15 | 10.42% | 144 |
Bozrah | 182 | 54.49% | 148 | 44.31% | 2 | 0.60% | 0 | 0.00% | 1 | 0.30% | 1 | 0.30% | 34 | 10.18% | 334 |
Branford | 1,334 | 69.05% | 525 | 27.17% | 58 | 3.00% | 1 | 0.05% | 8 | 0.41% | 6 | 0.31% | 809 | 41.87% | 1,932 |
Bridgeport | 21,526 | 63.63% | 10,591 | 31.31% | 1,274 | 3.77% | 246 | 0.73% | 64 | 0.19% | 128 | 0.38% | 10,935 | 32.32% | 33,829 |
Bridgewater | 99 | 52.11% | 91 | 47.89% | 0 | 0.00% | 0 | 0.00% | 0 | 0.00% | 0 | 0.00% | 8 | 4.21% | 190 |
Bristol | 3,429 | 63.78% | 1,770 | 32.92% | 106 | 1.97% | 20 | 0.37% | 42 | 0.78% | 9 | 0.17% | 1,659 | 30.86% | 5,376 |
Brookfield | 265 | 74.65% | 84 | 23.66% | 1 | 0.28% | 0 | 0.00% | 5 | 1.41% | 0 | 0.00% | 181 | 50.99% | 355 |
Brooklyn | 304 | 62.55% | 176 | 36.21% | 3 | 0.62% | 0 | 0.00% | 2 | 0.41% | 1 | 0.21% | 128 | 26.34% | 486 |
Burlington | 178 | 70.63% | 74 | 29.37% | 0 | 0.00% | 0 | 0.00% | 0 | 0.00% | 0 | 0.00% | 104 | 41.27% | 252 |
Canaan | 169 | 75.11% | 53 | 23.56% | 0 | 0.00% | 0 | 0.00% | 3 | 1.33% | 0 | 0.00% | 116 | 51.56% | 225 |
Canterbury | 169 | 67.06% | 79 | 31.35% | 0 | 0.00% | 1 | 0.40% | 3 | 1.19% | 0 | 0.00% | 90 | 35.71% | 252 |
Canton | 649 | 72.03% | 243 | 26.97% | 4 | 0.44% | 1 | 0.11% | 4 | 0.44% | 0 | 0.00% | 406 | 45.06% | 901 |
Chaplin | 97 | 77.60% | 25 | 20.00% | 2 | 1.60% | 0 | 0.00% | 1 | 0.80% | 0 | 0.00% | 72 | 57.60% | 125 |
Cheshire | 598 | 76.18% | 170 | 21.66% | 5 | 0.64% | 5 | 0.64% | 6 | 0.76% | 1 | 0.13% | 428 | 54.52% | 785 |
Chester | 316 | 73.66% | 104 | 24.24% | 5 | 1.17% | 1 | 0.23% | 2 | 0.47% | 1 | 0.23% | 212 | 49.42% | 429 |
Clinton | 312 | 81.25% | 50 | 13.02% | 2 | 0.52% | 3 | 0.78% | 17 | 4.43% | 0 | 0.00% | 262 | 68.23% | 384 |
Colchester | 339 | 67.66% | 138 | 27.54% | 19 | 3.79% | 3 | 0.60% | 2 | 0.40% | 0 | 0.00% | 201 | 40.12% | 501 |
Colebrook | 112 | 77.78% | 30 | 20.83% | 0 | 0.00% | 1 | 0.69% | 1 | 0.69% | 0 | 0.00% | 82 | 56.94% | 144 |
Columbia | 151 | 75.50% | 46 | 23.00% | 3 | 1.50% | 0 | 0.00% | 0 | 0.00% | 0 | 0.00% | 105 | 52.50% | 200 |
Cornwall | 238 | 56.67% | 176 | 41.90% | 3 | 0.71% | 1 | 0.24% | 2 | 0.48% | 0 | 0.00% | 62 | 14.76% | 420 |
Coventry | 421 | 65.17% | 223 | 34.52% | 0 | 0.00% | 1 | 0.15% | 1 | 0.15% | 0 | 0.00% | 198 | 30.65% | 646 |
Cromwell | 497 | 78.89% | 112 | 17.78% | 9 | 1.43% | 7 | 1.11% | 4 | 0.63% | 1 | 0.16% | 385 | 61.11% | 630 |
Danbury | 4,769 | 60.88% | 2,842 | 36.28% | 126 | 1.61% | 16 | 0.20% | 66 | 0.84% | 15 | 0.19% | 1,927 | 24.60% | 7,834 |
Darien | 878 | 80.48% | 192 | 17.60% | 13 | 1.19% | 5 | 0.46% | 3 | 0.27% | 0 | 0.00% | 686 | 62.88% | 1,091 |
Derby | 1,461 | 49.44% | 1,391 | 47.07% | 76 | 2.57% | 12 | 0.41% | 5 | 0.17% | 10 | 0.34% | 70 | 2.37% | 2,955 |
Durham | 230 | 69.28% | 100 | 30.12% | 0 | 0.00% | 0 | 0.00% | 1 | 0.30% | 1 | 0.30% | 130 | 39.16% | 332 |
East Granby | 210 | 70.00% | 87 | 29.00% | 0 | 0.00% | 1 | 0.33% | 1 | 0.33% | 1 | 0.33% | 123 | 41.00% | 300 |
East Haddam | 419 | 81.68% | 89 | 17.35% | 3 | 0.58% | 0 | 0.00% | 2 | 0.39% | 0 | 0.00% | 330 | 64.33% | 513 |
East Hampton | 569 | 62.80% | 296 | 32.67% | 21 | 2.32% | 5 | 0.55% | 15 | 1.66% | 0 | 0.00% | 273 | 30.13% | 906 |
East Hartford | 1,797 | 59.98% | 1,075 | 35.88% | 53 | 1.77% | 39 | 1.30% | 11 | 0.37% | 21 | 0.70% | 722 | 24.10% | 2,996 |
East Haven | 679 | 72.85% | 209 | 22.42% | 35 | 3.76% | 0 | 0.00% | 3 | 0.32% | 6 | 0.64% | 470 | 50.43% | 932 |
East Lyme | 452 | 71.41% | 166 | 26.22% | 3 | 0.47% | 1 | 0.16% | 10 | 1.58% | 1 | 0.16% | 286 | 45.18% | 633 |
East Windsor | 703 | 66.64% | 316 | 29.95% | 26 | 2.46% | 3 | 0.28% | 5 | 0.47% | 2 | 0.19% | 387 | 36.68% | 1,055 |
Eastford | 129 | 79.14% | 32 | 19.63% | 0 | 0.00% | 1 | 0.61% | 1 | 0.61% | 0 | 0.00% | 97 | 59.51% | 163 |
Easton | 210 | 67.09% | 101 | 32.27% | 0 | 0.00% | 1 | 0.32% | 1 | 0.32% | 0 | 0.00% | 109 | 34.82% | 313 |
Ellington | 402 | 66.45% | 175 | 28.93% | 18 | 2.98% | 1 | 0.17% | 3 | 0.50% | 6 | 0.99% | 227 | 37.52% | 605 |
Enfield | 1,776 | 61.33% | 1,085 | 37.47% | 9 | 0.31% | 2 | 0.07% | 20 | 0.69% | 4 | 0.14% | 691 | 23.86% | 2,896 |
Essex | 711 | 73.53% | 239 | 24.72% | 6 | 0.62% | 3 | 0.31% | 8 | 0.83% | 0 | 0.00% | 472 | 48.81% | 967 |
Fairfield | 1,528 | 72.87% | 500 | 23.84% | 26 | 1.24% | 19 | 0.91% | 14 | 0.67% | 10 | 0.48% | 1,028 | 49.02% | 2,097 |
Farmington | 839 | 58.14% | 590 | 40.89% | 10 | 0.69% | 0 | 0.00% | 4 | 0.28% | 0 | 0.00% | 249 | 17.26% | 1,443 |
Franklin | 139 | 85.80% | 23 | 14.20% | 0 | 0.00% | 0 | 0.00% | 0 | 0.00% | 0 | 0.00% | 116 | 71.60% | 162 |
Glastonbury | 820 | 59.68% | 529 | 38.50% | 14 | 1.02% | 9 | 0.66% | 1 | 0.07% | 1 | 0.07% | 291 | 21.18% | 1,374 |
Goshen | 149 | 76.41% | 43 | 22.05% | 0 | 0.00% | 0 | 0.00% | 3 | 1.54% | 0 | 0.00% | 106 | 54.36% | 195 |
Granby | 311 | 75.85% | 91 | 22.20% | 0 | 0.00% | 0 | 0.00% | 8 | 1.95% | 0 | 0.00% | 220 | 53.66% | 410 |
Greenwich | 3,669 | 75.12% | 1,096 | 22.44% | 76 | 1.56% | 24 | 0.49% | 7 | 0.14% | 12 | 0.25% | 2,573 | 52.68% | 4,884 |
Griswold | 568 | 54.51% | 466 | 44.72% | 2 | 0.19% | 0 | 0.00% | 5 | 0.48% | 1 | 0.10% | 102 | 9.79% | 1,042 |
Groton | 1,570 | 70.98% | 574 | 25.95% | 42 | 1.90% | 3 | 0.14% | 19 | 0.86% | 4 | 0.18% | 996 | 45.03% | 2,212 |
Guilford | 675 | 76.19% | 168 | 18.96% | 13 | 1.47% | 2 | 0.23% | 26 | 2.93% | 2 | 0.23% | 507 | 57.22% | 886 |
Haddam | 357 | 68.52% | 163 | 31.29% | 0 | 0.00% | 0 | 0.00% | 1 | 0.19% | 0 | 0.00% | 194 | 37.24% | 521 |
Hamden | 1,673 | 76.95% | 351 | 16.15% | 117 | 5.38% | 4 | 0.18% | 10 | 0.46% | 19 | 0.87% | 1,322 | 60.81% | 2,174 |
Hampton | 153 | 82.26% | 32 | 17.20% | 0 | 0.00% | 1 | 0.54% | 0 | 0.00% | 0 | 0.00% | 121 | 65.05% | 186 |
Hartford | 21,257 | 55.52% | 14,412 | 37.64% | 1,486 | 3.88% | 713 | 1.86% | 195 | 0.51% | 221 | 0.58% | 6,845 | 17.88% | 38,284 |
Hartland | 85 | 80.19% | 20 | 18.87% | 0 | 0.00% | 0 | 0.00% | 1 | 0.94% | 0 | 0.00% | 65 | 61.32% | 106 |
Harwinton | 219 | 75.00% | 59 | 20.21% | 10 | 3.42% | 1 | 0.34% | 1 | 0.34% | 2 | 0.68% | 160 | 54.79% | 292 |
Hebron | 189 | 74.41% | 65 | 25.59% | 0 | 0.00% | 0 | 0.00% | 0 | 0.00% | 0 | 0.00% | 124 | 48.82% | 254 |
Kent | 250 | 70.03% | 106 | 29.69% | 0 | 0.00% | 0 | 0.00% | 1 | 0.28% | 0 | 0.00% | 144 | 40.34% | 357 |
Killingly | 1,324 | 70.73% | 518 | 27.67% | 8 | 0.43% | 0 | 0.00% | 20 | 1.07% | 2 | 0.11% | 806 | 43.06% | 1,872 |
Killingworth | 99 | 74.44% | 28 | 21.05% | 5 | 3.76% | 1 | 0.75% | 0 | 0.00% | 0 | 0.00% | 71 | 53.38% | 133 |
Lebanon | 320 | 92.49% | 25 | 7.23% | 0 | 0.00% | 0 | 0.00% | 1 | 0.29% | 0 | 0.00% | 295 | 85.26% | 346 |
Ledyard | 186 | 70.72% | 73 | 27.76% | 2 | 0.76% | 0 | 0.00% | 2 | 0.76% | 0 | 0.00% | 113 | 42.97% | 263 |
Lisbon | 156 | 73.58% | 46 | 21.70% | 9 | 4.25% | 0 | 0.00% | 1 | 0.47% | 0 | 0.00% | 110 | 51.89% | 212 |
Litchfield | 711 | 61.99% | 400 | 34.87% | 25 | 2.18% | 0 | 0.00% | 10 | 0.87% | 1 | 0.09% | 311 | 27.11% | 1,147 |
Lyme | 174 | 79.09% | 42 | 19.09% | 1 | 0.45% | 0 | 0.00% | 3 | 1.36% | 0 | 0.00% | 132 | 60.00% | 220 |
Madison | 445 | 87.60% | 34 | 6.69% | 14 | 2.76% | 2 | 0.39% | 13 | 2.56% | 0 | 0.00% | 411 | 80.91% | 508 |
Manchester | 3,017 | 65.64% | 1,316 | 28.63% | 150 | 3.26% | 9 | 0.20% | 73 | 1.59% | 31 | 0.67% | 1,701 | 37.01% | 4,596 |
Mansfield | 452 | 73.62% | 155 | 25.24% | 2 | 0.33% | 0 | 0.00% | 5 | 0.81% | 0 | 0.00% | 297 | 48.37% | 614 |
Marlborough | 63 | 55.26% | 49 | 42.98% | 1 | 0.88% | 0 | 0.00% | 1 | 0.88% | 0 | 0.00% | 14 | 12.28% | 114 |
Meriden | 7,258 | 62.50% | 3,959 | 34.09% | 285 | 2.45% | 16 | 0.14% | 59 | 0.51% | 36 | 0.31% | 3,299 | 28.41% | 11,613 |
Middlebury | 200 | 74.07% | 63 | 23.33% | 4 | 1.48% | 0 | 0.00% | 3 | 1.11% | 0 | 0.00% | 137 | 50.74% | 270 |
Middlefield | 179 | 83.26% | 35 | 16.28% | 1 | 0.47% | 0 | 0.00% | 0 | 0.00% | 0 | 0.00% | 144 | 66.98% | 215 |
Middletown | 3,005 | 57.68% | 2,065 | 39.64% | 67 | 1.29% | 52 | 1.00% | 9 | 0.17% | 12 | 0.23% | 940 | 18.04% | 5,210 |
Milford | 2,476 | 76.11% | 606 | 18.63% | 100 | 3.07% | 13 | 0.40% | 49 | 1.51% | 9 | 0.28% | 1,870 | 57.49% | 3,253 |
Monroe | 265 | 68.83% | 114 | 29.61% | 4 | 1.04% | 0 | 0.00% | 1 | 0.26% | 1 | 0.26% | 151 | 39.22% | 385 |
Montville | 542 | 74.35% | 167 | 22.91% | 14 | 1.92% | 2 | 0.27% | 4 | 0.55% | 0 | 0.00% | 375 | 51.44% | 729 |
Morris | 113 | 57.95% | 80 | 41.03% | 0 | 0.00% | 0 | 0.00% | 2 | 1.03% | 0 | 0.00% | 33 | 16.92% | 195 |
Naugatuck | 2,084 | 53.67% | 1,593 | 41.02% | 171 | 4.40% | 8 | 0.21% | 10 | 0.26% | 17 | 0.44% | 491 | 12.64% | 3,883 |
New Britain | 8,192 | 63.49% | 3,863 | 29.94% | 455 | 3.53% | 213 | 1.65% | 92 | 0.71% | 88 | 0.68% | 4,329 | 33.55% | 12,903 |
New Canaan | 948 | 76.51% | 267 | 21.55% | 13 | 1.05% | 5 | 0.40% | 6 | 0.48% | 0 | 0.00% | 681 | 54.96% | 1,239 |
New Fairfield | 109 | 72.19% | 40 | 26.49% | 0 | 0.00% | 0 | 0.00% | 2 | 1.32% | 0 | 0.00% | 69 | 45.70% | 151 |
New Hartford | 325 | 60.07% | 212 | 39.19% | 0 | 0.00% | 1 | 0.18% | 2 | 0.37% | 1 | 0.18% | 113 | 20.89% | 541 |
New Haven | 24,297 | 59.77% | 13,605 | 33.47% | 2,258 | 5.55% | 64 | 0.16% | 118 | 0.29% | 307 | 0.76% | 10,692 | 26.30% | 40,649 |
New London | 4,088 | 62.39% | 2,245 | 34.26% | 135 | 2.06% | 9 | 0.14% | 48 | 0.73% | 27 | 0.41% | 1,843 | 28.13% | 6,552 |
New Milford | 1,011 | 62.64% | 571 | 35.38% | 16 | 0.99% | 5 | 0.31% | 11 | 0.68% | 0 | 0.00% | 440 | 27.26% | 1,614 |
Newington | 408 | 70.83% | 140 | 24.31% | 12 | 2.08% | 7 | 1.22% | 8 | 1.39% | 1 | 0.17% | 268 | 46.53% | 576 |
Newtown | 540 | 49.86% | 527 | 48.66% | 7 | 0.65% | 1 | 0.09% | 7 | 0.65% | 1 | 0.09% | 13 | 1.20% | 1,083 |
Norfolk | 350 | 57.19% | 256 | 41.83% | 1 | 0.16% | 1 | 0.16% | 2 | 0.33% | 2 | 0.33% | 94 | 15.36% | 612 |
North Branford | 185 | 78.72% | 47 | 20.00% | 0 | 0.00% | 1 | 0.43% | 2 | 0.85% | 0 | 0.00% | 138 | 58.72% | 235 |
North Canaan | 462 | 69.06% | 200 | 29.90% | 1 | 0.15% | 1 | 0.15% | 2 | 0.30% | 3 | 0.45% | 262 | 39.16% | 669 |
North Haven | 546 | 83.87% | 83 | 12.75% | 11 | 1.69% | 0 | 0.00% | 11 | 1.69% | 0 | 0.00% | 463 | 71.12% | 651 |
North Stonington | 194 | 56.56% | 133 | 38.78% | 4 | 1.17% | 2 | 0.58% | 7 | 2.04% | 3 | 0.87% | 61 | 17.78% | 343 |
Norwalk | 5,199 | 70.11% | 2,042 | 27.54% | 102 | 1.38% | 25 | 0.34% | 22 | 0.30% | 25 | 0.34% | 3,157 | 42.58% | 7,415 |
Norwich | 4,887 | 57.95% | 3,296 | 39.08% | 187 | 2.22% | 18 | 0.21% | 30 | 0.36% | 15 | 0.18% | 1,591 | 18.87% | 8,433 |
Old Lyme | 265 | 60.36% | 166 | 37.81% | 3 | 0.68% | 1 | 0.23% | 3 | 0.68% | 1 | 0.23% | 99 | 22.55% | 439 |
Old Saybrook | 238 | 73.46% | 82 | 25.31% | 2 | 0.62% | 1 | 0.31% | 0 | 0.00% | 1 | 0.31% | 156 | 48.15% | 324 |
Orange | 3,242 | 71.10% | 1,032 | 22.63% | 230 | 5.04% | 6 | 0.13% | 19 | 0.42% | 31 | 0.68% | 2,210 | 48.46% | 4,560 |
Oxford | 192 | 71.11% | 78 | 28.89% | 0 | 0.00% | 0 | 0.00% | 0 | 0.00% | 0 | 0.00% | 114 | 42.22% | 270 |
Plainfield | 888 | 55.22% | 703 | 43.72% | 12 | 0.75% | 1 | 0.06% | 2 | 0.12% | 2 | 0.12% | 185 | 11.50% | 1,608 |
Plainville | 858 | 72.84% | 275 | 23.34% | 27 | 2.29% | 1 | 0.08% | 14 | 1.19% | 3 | 0.25% | 583 | 49.49% | 1,178 |
Plymouth | 736 | 60.83% | 408 | 33.72% | 32 | 2.64% | 11 | 0.91% | 20 | 1.65% | 3 | 0.25% | 328 | 27.11% | 1,210 |
Pomfret | 373 | 72.99% | 132 | 25.83% | 3 | 0.59% | 0 | 0.00% | 2 | 0.39% | 1 | 0.20% | 241 | 47.16% | 511 |
Portland | 795 | 55.17% | 612 | 42.47% | 2 | 0.14% | 20 | 1.39% | 8 | 0.56% | 4 | 0.28% | 183 | 12.70% | 1,441 |
Preston | 267 | 72.36% | 93 | 25.20% | 6 | 1.63% | 0 | 0.00% | 3 | 0.81% | 0 | 0.00% | 174 | 47.15% | 369 |
Prospect | 118 | 83.69% | 19 | 13.48% | 4 | 2.84% | 0 | 0.00% | 0 | 0.00% | 0 | 0.00% | 99 | 70.21% | 141 |
Putnam | 1,321 | 60.43% | 848 | 38.79% | 7 | 0.32% | 5 | 0.23% | 5 | 0.23% | 0 | 0.00% | 473 | 21.64% | 2,186 |
Redding | 358 | 62.81% | 206 | 36.14% | 1 | 0.18% | 0 | 0.00% | 5 | 0.88% | 0 | 0.00% | 152 | 26.67% | 570 |
Ridgefield | 691 | 77.82% | 174 | 19.59% | 5 | 0.56% | 4 | 0.45% | 6 | 0.68% | 8 | 0.90% | 517 | 58.22% | 888 |
Rocky Hill | 283 | 67.38% | 126 | 30.00% | 3 | 0.71% | 3 | 0.71% | 5 | 1.19% | 0 | 0.00% | 157 | 37.38% | 420 |
Roxbury | 121 | 59.61% | 79 | 38.92% | 1 | 0.49% | 0 | 0.00% | 2 | 0.99% | 0 | 0.00% | 42 | 20.69% | 203 |
Salem | 66 | 80.49% | 16 | 19.51% | 0 | 0.00% | 0 | 0.00% | 0 | 0.00% | 0 | 0.00% | 50 | 60.98% | 82 |
Salisbury | 616 | 67.99% | 287 | 31.68% | 0 | 0.00% | 2 | 0.22% | 1 | 0.11% | 0 | 0.00% | 329 | 36.31% | 906 |
Saybrook | 545 | 76.87% | 155 | 21.86% | 5 | 0.71% | 2 | 0.28% | 1 | 0.14% | 1 | 0.14% | 390 | 55.01% | 709 |
Scotland | 116 | 72.96% | 31 | 19.50% | 3 | 1.89% | 0 | 0.00% | 9 | 5.66% | 0 | 0.00% | 85 | 53.46% | 159 |
Seymour | 1,311 | 76.00% | 398 | 23.07% | 15 | 0.87% | 1 | 0.06% | 0 | 0.00% | 0 | 0.00% | 913 | 52.93% | 1,725 |
Sharon | 364 | 74.13% | 124 | 25.25% | 0 | 0.00% | 0 | 0.00% | 3 | 0.61% | 0 | 0.00% | 240 | 48.88% | 491 |
Shelton | 1,553 | 65.28% | 697 | 29.30% | 104 | 4.37% | 6 | 0.25% | 6 | 0.25% | 13 | 0.55% | 856 | 35.98% | 2,379 |
Sherman | 131 | 73.18% | 44 | 24.58% | 0 | 0.00% | 2 | 1.12% | 1 | 0.56% | 1 | 0.56% | 87 | 48.60% | 179 |
Simsbury | 502 | 60.41% | 305 | 36.70% | 3 | 0.36% | 3 | 0.36% | 18 | 2.17% | 0 | 0.00% | 197 | 23.71% | 831 |
Somers | 303 | 69.18% | 129 | 29.45% | 4 | 0.91% | 0 | 0.00% | 1 | 0.23% | 1 | 0.23% | 174 | 39.73% | 438 |
South Windsor | 358 | 62.70% | 192 | 33.63% | 5 | 0.88% | 6 | 1.05% | 9 | 1.58% | 1 | 0.18% | 166 | 29.07% | 571 |
Southbury | 246 | 66.13% | 125 | 33.60% | 1 | 0.27% | 0 | 0.00% | 0 | 0.00% | 0 | 0.00% | 121 | 32.53% | 372 |
Southington | 1,286 | 66.32% | 585 | 30.17% | 42 | 2.17% | 5 | 0.26% | 14 | 0.72% | 7 | 0.36% | 701 | 36.15% | 1,939 |
Sprague | 388 | 58.97% | 242 | 36.78% | 11 | 1.67% | 4 | 0.61% | 13 | 1.98% | 0 | 0.00% | 146 | 22.19% | 658 |
Stafford | 815 | 61.56% | 428 | 32.33% | 48 | 3.63% | 1 | 0.08% | 7 | 0.53% | 25 | 1.89% | 387 | 29.23% | 1,324 |
Stamford | 7,129 | 65.44% | 3,512 | 32.24% | 175 | 1.61% | 21 | 0.19% | 21 | 0.19% | 36 | 0.33% | 3,617 | 33.20% | 10,894 |
Sterling | 211 | 59.44% | 138 | 38.87% | 4 | 1.13% | 0 | 0.00% | 0 | 0.00% | 2 | 0.56% | 73 | 20.56% | 355 |
Stonington | 1,809 | 63.65% | 869 | 30.58% | 93 | 3.27% | 14 | 0.49% | 21 | 0.74% | 36 | 1.27% | 940 | 33.08% | 2,842 |
Stratford | 2,415 | 75.71% | 569 | 17.84% | 128 | 4.01% | 31 | 0.97% | 22 | 0.69% | 25 | 0.78% | 1,846 | 57.87% | 3,190 |
Suffield | 913 | 72.75% | 330 | 26.29% | 3 | 0.24% | 2 | 0.16% | 6 | 0.48% | 1 | 0.08% | 583 | 46.45% | 1,255 |
Thomaston | 841 | 66.22% | 411 | 32.36% | 13 | 1.02% | 2 | 0.16% | 2 | 0.16% | 1 | 0.08% | 430 | 33.86% | 1,270 |
Thompson | 597 | 61.48% | 365 | 37.59% | 7 | 0.72% | 1 | 0.10% | 1 | 0.10% | 0 | 0.00% | 232 | 23.89% | 971 |
Tolland | 127 | 49.80% | 113 | 44.31% | 3 | 1.18% | 1 | 0.39% | 5 | 1.96% | 6 | 2.35% | 14 | 5.49% | 255 |
Torrington | 3,524 | 66.39% | 1,581 | 29.79% | 138 | 2.60% | 18 | 0.34% | 17 | 0.32% | 30 | 0.57% | 1,943 | 36.61% | 5,308 |
Trumbull | 558 | 73.32% | 185 | 24.31% | 7 | 0.92% | 7 | 0.92% | 2 | 0.26% | 2 | 0.26% | 373 | 49.01% | 761 |
Union | 55 | 63.95% | 31 | 36.05% | 0 | 0.00% | 0 | 0.00% | 0 | 0.00% | 0 | 0.00% | 24 | 27.91% | 86 |
Vernon | 1,764 | 64.26% | 812 | 29.58% | 132 | 4.81% | 4 | 0.15% | 10 | 0.36% | 23 | 0.84% | 952 | 34.68% | 2,745 |
Voluntown | 125 | 65.10% | 65 | 33.85% | 1 | 0.52% | 0 | 0.00% | 0 | 0.00% | 1 | 0.52% | 60 | 31.25% | 192 |
Wallingford | 2,024 | 62.07% | 1,096 | 33.61% | 108 | 3.31% | 5 | 0.15% | 23 | 0.71% | 5 | 0.15% | 928 | 28.46% | 3,261 |
Warren | 90 | 67.67% | 37 | 27.82% | 1 | 0.75% | 1 | 0.75% | 3 | 2.26% | 1 | 0.75% | 53 | 39.85% | 133 |
Washington | 469 | 68.17% | 212 | 30.81% | 2 | 0.29% | 2 | 0.29% | 3 | 0.44% | 0 | 0.00% | 257 | 37.35% | 688 |
Waterbury | 11,161 | 50.39% | 10,110 | 45.64% | 743 | 3.35% | 24 | 0.11% | 35 | 0.16% | 78 | 0.35% | 1,051 | 4.74% | 22,151 |
Waterford | 705 | 73.74% | 216 | 22.59% | 23 | 2.41% | 3 | 0.31% | 5 | 0.52% | 4 | 0.42% | 489 | 51.15% | 956 |
Watertown | 930 | 76.48% | 261 | 21.46% | 17 | 1.40% | 0 | 0.00% | 4 | 0.33% | 4 | 0.33% | 669 | 55.02% | 1,216 |
West Hartford | 2,310 | 72.92% | 747 | 23.58% | 52 | 1.64% | 24 | 0.76% | 12 | 0.38% | 23 | 0.73% | 1,563 | 49.34% | 3,168 |
Westbrook | 175 | 74.79% | 40 | 17.09% | 8 | 3.42% | 1 | 0.43% | 3 | 1.28% | 7 | 2.99% | 135 | 57.69% | 234 |
Weston | 158 | 69.00% | 65 | 28.38% | 1 | 0.44% | 3 | 1.31% | 1 | 0.44% | 1 | 0.44% | 93 | 40.61% | 229 |
Westport | 1,038 | 71.00% | 383 | 26.20% | 35 | 2.39% | 0 | 0.00% | 2 | 0.14% | 4 | 0.27% | 655 | 44.80% | 1,462 |
Wethersfield | 916 | 68.36% | 390 | 29.10% | 14 | 1.04% | 10 | 0.75% | 7 | 0.52% | 3 | 0.22% | 526 | 39.25% | 1,340 |
Willington | 271 | 90.94% | 21 | 7.05% | 1 | 0.34% | 1 | 0.34% | 4 | 1.34% | 0 | 0.00% | 250 | 83.89% | 298 |
Wilton | 410 | 72.82% | 133 | 23.62% | 7 | 1.24% | 2 | 0.36% | 11 | 1.95% | 0 | 0.00% | 277 | 49.20% | 563 |
Winchester | 1,788 | 62.74% | 1,025 | 35.96% | 16 | 0.56% | 8 | 0.28% | 11 | 0.39% | 2 | 0.07% | 763 | 26.77% | 2,850 |
Windham | 2,410 | 55.81% | 1,830 | 42.38% | 36 | 0.83% | 13 | 0.30% | 29 | 0.67% | 0 | 0.00% | 580 | 13.43% | 4,318 |
Windsor | 974 | 66.85% | 433 | 29.72% | 18 | 1.24% | 12 | 0.82% | 19 | 1.30% | 1 | 0.07% | 541 | 37.13% | 1,457 |
Windsor Locks | 486 | 43.51% | 616 | 55.15% | 6 | 0.54% | 3 | 0.27% | 3 | 0.27% | 3 | 0.27% | -130 | -11.64% | 1,117 |
Wolcott | 137 | 83.03% | 26 | 15.76% | 2 | 1.21% | 0 | 0.00% | 0 | 0.00% | 0 | 0.00% | 111 | 67.27% | 165 |
Woodbridge | 236 | 85.82% | 26 | 9.45% | 7 | 2.55% | 0 | 0.00% | 6 | 2.18% | 0 | 0.00% | 210 | 76.36% | 275 |
Woodbury | 437 | 75.47% | 134 | 23.14% | 5 | 0.86% | 1 | 0.17% | 2 | 0.35% | 0 | 0.00% | 303 | 52.33% | 579 |
Woodstock | 399 | 82.27% | 78 | 16.08% | 3 | 0.62% | 1 | 0.21% | 4 | 0.82% | 0 | 0.00% | 321 | 66.19% | 485 |
Totals | 229,238 | 62.72% | 120,721 | 33.03% | 10,350 | 2.83% | 1,947 | 0.53% | 1,771 | 0.48% | 1,491 | 0.41% | 108,517 | 29.69% | 365,518 |
The 1920 Republican National Convention nominated Ohio Senator Warren G. Harding for president and Massachusetts Governor Calvin Coolidge for vice president. The convention was held in Chicago, Illinois, at the Chicago Coliseum from June 8 to June 12, 1920, with 940 delegates. Under convention rules, a majority plus one, or at least 471 of the 940 delegates, was necessary for a nomination.
The 1920 United States presidential election in New York took place on November 2, 1920. All contemporary 48 states were part of the 1920 United States presidential election. Voters chose 45 electors to the Electoral College, which selected the president and vice president.
The 1920 United States presidential election in Massachusetts took place on November 2, 1920, as part of the 1920 United States presidential election, which was held throughout all contemporary 48 states. Voters chose 18 representatives, or electors to the Electoral College, who voted for president and vice president.
The 1920 United States presidential election in Vermont took place on November 2, 1920, as part of the 1920 United States presidential election which was held throughout all contemporary 48 states. Voters chose four representatives, or electors to the Electoral College, who voted for president and vice president.
The 1920 United States presidential election in New Jersey took place on November 2, 1920. All contemporary 48 states were part of the 1920 United States presidential election. Voters chose 14 electors to the Electoral College, which selected the president and vice president.
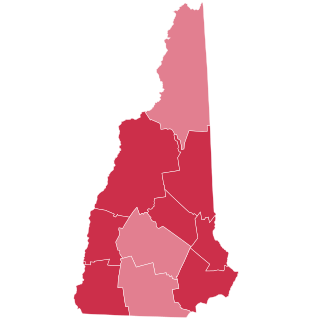
The 1920 United States presidential election in New Hampshire took place on November 2, 1920, as part of the 1920 United States presidential election which was held throughout all contemporary 48 states. Voters chose four representatives, or electors to the Electoral College, who voted for president and vice president.
The 1920 United States presidential election in Maine took place on November 2, 1920, as part of the 1920 United States presidential election which was held throughout all contemporary 48 states. Voters chose six representatives, or electors to the Electoral College, who voted for president and vice president.
The 1920 United States presidential election in Rhode Island took place on November 2, 1920, as part of the 1920 United States presidential election which was held throughout all contemporary 48 states. Voters chose five representatives, or electors to the Electoral College, who voted for president and vice president.
The 1924 United States presidential election in Connecticut took place on November 4, 1924, as part of the 1924 United States presidential election which was held throughout all contemporary 48 states. Voters chose seven representatives, or electors to the Electoral College, who voted for president and vice president.
The 1920 United States presidential election in South Carolina took place on November 2, 1920, as part of the 1920 United States presidential election which was held throughout all contemporary 48 states. Voters chose 9 representatives, or electors to the Electoral College, who voted for president and vice president.
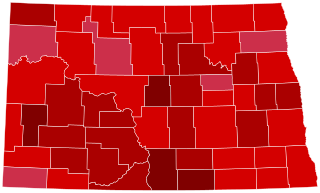
The 1920 United States presidential election in North Dakota took place on November 2, 1920, as part of the 1920 United States presidential election which was held throughout all contemporary 48 states. Voters chose five representatives, or electors to the Electoral College, who voted for president and vice president.
The 1920 United States presidential election in Iowa took place on November 2, 1920, as part of the 1920 United States presidential election which was held throughout all contemporary 48 states. Voters chose 13 representatives, or electors to the Electoral College, who voted for president and vice president.
The 1920 United States presidential election in West Virginia took place on November 2, 1920, as part of the 1920 United States presidential election which was held throughout all contemporary 48 states. Voters chose eight representatives, or electors to the Electoral College, who voted for president and vice president.
The 1920 United States presidential election in Kansas was held on November 2, 1920 as part of the 1920 United States presidential election. Kansas voters chose ten electors to the Electoral College, who voted for president and vice president.
The 1920 United States presidential election in Nevada took place on November 2, 1920, as part of the 1920 United States presidential election which was held throughout all contemporary 48 states. Voters chose seven representatives, or electors to the Electoral College, who voted for president and vice president.
The 1920 United States presidential election in Indiana took place on November 2, 1920, as part of the 1920 United States presidential election which was held throughout all contemporary 48 states. Voters chose 15 representatives, or electors to the Electoral College, who voted for president and vice president.
The 1920 United States presidential election in Oklahoma took place on November 2, 1920, as part of the 1920 United States presidential election which was held throughout all contemporary 48 states. Voters chose ten representatives, or electors to the Electoral College, who voted for president and vice president.
The 1920 United States presidential election in Delaware took place on November 2, 1920. All contemporary 48 states were part of the 1920 United States presidential election. State voters chose three electors to the Electoral College, which selected the president and vice president.
The 1920 United States presidential election in Nebraska took place on November 2, 1920, as part of the 1920 United States presidential election which was held throughout all contemporary 48 states. Voters chose eight representatives, or electors to the Electoral College, who voted for president and vice president.
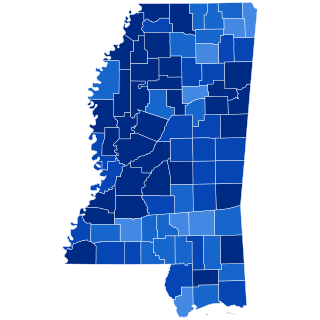
The 1920 United States presidential election in Mississippi took place on November 2, 1920, as part of the 1920 United States presidential election which was held throughout all contemporary 48 states. Voters chose 10 representatives, or electors to the Electoral College, who voted for president and vice president. In Mississippi, voters voted for electors individually instead of as a slate, as in the other states.