In mathematics, two quantities are in the golden ratio if their ratio is the same as the ratio of their sum to the larger of the two quantities. Expressed algebraically, for quantities and with , is in a golden ratio to if
In solid-state physics, the work function is the minimum thermodynamic work needed to remove an electron from a solid to a point in the vacuum immediately outside the solid surface. Here "immediately" means that the final electron position is far from the surface on the atomic scale, but still too close to the solid to be influenced by ambient electric fields in the vacuum. The work function is not a characteristic of a bulk material, but rather a property of the surface of the material.

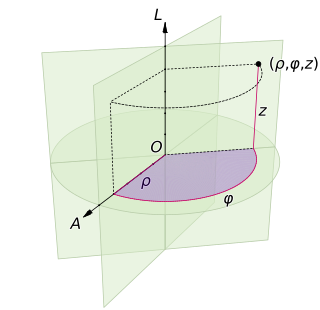
A cylindrical coordinate system is a three-dimensional coordinate system that specifies point positions by the distance from a chosen reference axis (axis L in the image opposite), the direction from the axis relative to a chosen reference direction (axis A), and the distance from a chosen reference plane perpendicular to the axis (plane containing the purple section). The latter distance is given as a positive or negative number depending on which side of the reference plane faces the point.
In frequentist statistics, power is a measure of the ability of an experimental design and hypothesis testing setup to detect a particular effect if it is truly present. In typical use, it is a function of the test used, the assumed distribution of the test, and the effect size of interest. High statistical power is related to low variability, large sample sizes, large effects being looked for, and less stringent requirements for statistical significance.

In mathematics, the inverse trigonometric functions are the inverse functions of the trigonometric functions, under suitably restricted domains. Specifically, they are the inverses of the sine, cosine, tangent, cotangent, secant, and cosecant functions, and are used to obtain an angle from any of the angle's trigonometric ratios. Inverse trigonometric functions are widely used in engineering, navigation, physics, and geometry.
In statistics, an effect size is a value measuring the strength of the relationship between two variables in a population, or a sample-based estimate of that quantity. It can refer to the value of a statistic calculated from a sample of data, the value of a parameter for a hypothetical population, or to the equation that operationalizes how statistics or parameters lead to the effect size value. Examples of effect sizes include the correlation between two variables, the regression coefficient in a regression, the mean difference, or the risk of a particular event happening. Effect sizes are a complement tool for statistical hypothesis testing, and play an important role in power analyses to assess the sample size required for new experiments. Effect size are fundamental in meta-analyses which aim to provide the combined effect size based on data from multiple studies. The cluster of data-analysis methods concerning effect sizes is referred to as estimation statistics.

In physics, the Josephson effect is a phenomenon that occurs when two superconductors are placed in proximity, with some barrier or restriction between them. The effect is named after the British physicist Brian Josephson, who predicted in 1962 the mathematical relationships for the current and voltage across the weak link. It is an example of a macroscopic quantum phenomenon, where the effects of quantum mechanics are observable at ordinary, rather than atomic, scale. The Josephson effect has many practical applications because it exhibits a precise relationship between different physical measures, such as voltage and frequency, facilitating highly accurate measurements.

The haversine formula determines the great-circle distance between two points on a sphere given their longitudes and latitudes. Important in navigation, it is a special case of a more general formula in spherical trigonometry, the law of haversines, that relates the sides and angles of spherical triangles.

The Mollweide projection is an equal-area, pseudocylindrical map projection generally used for maps of the world or celestial sphere. It is also known as the Babinet projection, homalographic projection, homolographic projection, and elliptical projection. The projection trades accuracy of angle and shape for accuracy of proportions in area, and as such is used where that property is needed, such as maps depicting global distributions.
In statistics, econometrics, and signal processing, an autoregressive (AR) model is a representation of a type of random process; as such, it can be used to describe certain time-varying processes in nature, economics, behavior, etc. The autoregressive model specifies that the output variable depends linearly on its own previous values and on a stochastic term ; thus the model is in the form of a stochastic difference equation which should not be confused with a differential equation. Together with the moving-average (MA) model, it is a special case and key component of the more general autoregressive–moving-average (ARMA) and autoregressive integrated moving average (ARIMA) models of time series, which have a more complicated stochastic structure; it is also a special case of the vector autoregressive model (VAR), which consists of a system of more than one interlocking stochastic difference equation in more than one evolving random variable.
Sample size determination or estimation is the act of choosing the number of observations or replicates to include in a statistical sample. The sample size is an important feature of any empirical study in which the goal is to make inferences about a population from a sample. In practice, the sample size used in a study is usually determined based on the cost, time, or convenience of collecting the data, and the need for it to offer sufficient statistical power. In complex studies, different sample sizes may be allocated, such as in stratified surveys or experimental designs with multiple treatment groups. In a census, data is sought for an entire population, hence the intended sample size is equal to the population. In experimental design, where a study may be divided into different treatment groups, there may be different sample sizes for each group.
In Bayesian statistics, the Jeffreys prior is a non-informative prior distribution for a parameter space. Named after Sir Harold Jeffreys, its density function is proportional to the square root of the determinant of the Fisher information matrix:
Functional data analysis (FDA) is a branch of statistics that analyses data providing information about curves, surfaces or anything else varying over a continuum. In its most general form, under an FDA framework, each sample element of functional data is considered to be a random function. The physical continuum over which these functions are defined is often time, but may also be spatial location, wavelength, probability, etc. Intrinsically, functional data are infinite dimensional. The high intrinsic dimensionality of these data brings challenges for theory as well as computation, where these challenges vary with how the functional data were sampled. However, the high or infinite dimensional structure of the data is a rich source of information and there are many interesting challenges for research and data analysis.

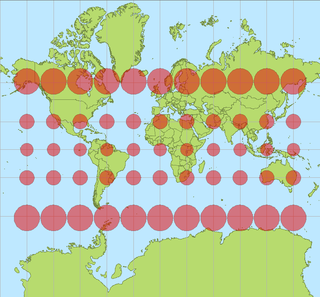
In cartography, a Tissot's indicatrix is a mathematical contrivance presented by French mathematician Nicolas Auguste Tissot in 1859 and 1871 in order to characterize local distortions due to map projection. It is the geometry that results from projecting a circle of infinitesimal radius from a curved geometric model, such as a globe, onto a map. Tissot proved that the resulting diagram is an ellipse whose axes indicate the two principal directions along which scale is maximal and minimal at that point on the map.

In probability theory and statistics, the characteristic function of any real-valued random variable completely defines its probability distribution. If a random variable admits a probability density function, then the characteristic function is the Fourier transform of the probability density function. Thus it provides an alternative route to analytical results compared with working directly with probability density functions or cumulative distribution functions. There are particularly simple results for the characteristic functions of distributions defined by the weighted sums of random variables.

The Cassini projection is a map projection first described in an approximate form by César-François Cassini de Thury in 1745. Its precise formulas were found through later analysis by Johann Georg von Soldner around 1810. It is the transverse aspect of the equirectangular projection, in that the globe is first rotated so the central meridian becomes the "equator", and then the normal equirectangular projection is applied. Considering the earth as a sphere, the projection is composed of the operations:

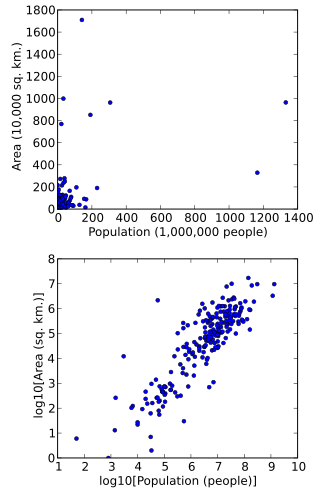
In statistics, data transformation is the application of a deterministic mathematical function to each point in a data set—that is, each data point zi is replaced with the transformed value yi = f(zi), where f is a function. Transforms are usually applied so that the data appear to more closely meet the assumptions of a statistical inference procedure that is to be applied, or to improve the interpretability or appearance of graphs.
In statistics, Cramér's V is a measure of association between two nominal variables, giving a value between 0 and +1 (inclusive). It is based on Pearson's chi-squared statistic and was published by Harald Cramér in 1946.


