In 1653, the second John Winthrop, son of Massachusetts Bay Colony's founding governor, obtained a grant of land formerly held by the Quinebaug Indian tribe and known as the Quinebaug (Long Pond) Country. The name Quinebaug comes from the southern New EnglandNative American term, spelled variously Qunnubbâgge, Quinibauge, etc., meaning "long pond", from qunni-, "long", and -paug, "pond".[4]
The area in that grant, which is now occupied by Killingly, was first settled by English colonists in 1700. It was first called "Aspinock", a word which may have come from the combination of the native term "aucks" or "ock" (the place of/where) and the name of the English settler, Lieutenant Aspinwall. When the town was incorporated in May 1708, Colony Governor Saltonstall was asked to suggest a name. Saltonstall's ancestral manorial possessions lay in Killanslie and Pontefract, Yorkshire, hence he suggested “Kellingly” (the spelling was later altered).
Davis Park
During the 1830s, Killingly was the state's largest producer of cotton goods, manufacturing textiles in mills from cotton shipped from the Deep South. By the 1930s, it was an important producer of window curtains.[5]
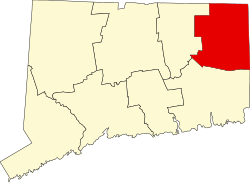
Geography
According to the United States Census Bureau, the town has a total area of 50.0 square miles (129km2), of which 48.5 square miles (126km2) is land and 1.5 square miles (3.9km2) (2.94%) is water.
Danielson Main Street Historic District – Main Street from Water Street to Spring Street (added 1992), featuring Colonial Revival and Italianate architectural styles.
As of the 2010 United States census,[6] there were 17,370 people, 6,749 households, and 4,528 families in the town. The population density was 358.1/square mile (137.9/km2). There were 7,592 housing units at an average density of 156.5/square mile (60.3/km2). The racial makeup of the town was 93.1% White, 1.5% African American, 0.4% Native American, 1.8% Asian, 0.7% from other races, and 2.4% from two or more races. Hispanic or Latino of any race were 3.0% of the population.
The borough of Danielson and the town of Killingly contain a small Laotian community. Both are on the nation's list of top 50 cities with the highest percentage of citizens claiming Laotian ancestry.[citation needed]
Of the 6,749 households: 29.2% had children under the age of 18 living with them, 47.8% were married couples living together, 13.2% had a female householder with no husband present, and 32.9% were non-families. 25.1% of all households were made up of individuals, and 9.9% had someone living alone who was 65 years of age or older. The average household size was 2.52 and the average family size was 2.98.
The area population contained 22.4% under the age of 18, 8.2% from 18 to 24, 27.0% from 25 to 44, 28.5% from 45 to 64, and 13.9% who were 65 years of age or older. The median age was 40 years. For every 100 females, there were 97.4 males. For every 100 females age 18 and over, there were 94.7 males.
The median income for a household in the town was $55,598, and the median income for a family was $68,565. Males had a median income of $49,467 versus $35,429 for females. The per capita income for the town was $26,585. About 8.5% of families and 10.3% of the population were below the poverty line, including 12.7% of those under age 18 and 6.1% of those age 65 or over.
Voter registration and party enrollment as of November 2022[7]
Manasseh Cutler (1742–1823), US representative, soldier, minister, botanist, doctor, and scientist. He was educated at both Yale and Harvard Universities. He lobbied Congress to pass the Northwest Ordinance of 1787, helped establish the Ohio Company, and worked to found Ohio University
Frederick Delmont Chesbrough (1859-1943), inventor of Warp Stop Motion for automated looms.
William Torrey Harris (1835–1909), a philosopher who introduced reindeer to Alaska, educator (and later U.S. Commissioner of Education) who introduced the first permanent kindergarten, and lexicographer who introduced the "divided page" into dictionaries (the 1909 edition of Webster's New International Dictionary). He was born in North Killingly. He also founded the first philosophical journal in the country
Mary Dixon Kies (1752–1837), the first woman in the United States to receive a patent (in 1809, for a method of weaving straw with silk or thread). Kies was born and lived in South Killingly, an unincorporated village in the Town of Killingly
This page is based on this Wikipedia article Text is available under the CC BY-SA 4.0 license; additional terms may apply. Images, videos and audio are available under their respective licenses.