West Rand | |
|---|---|
 Seal | |
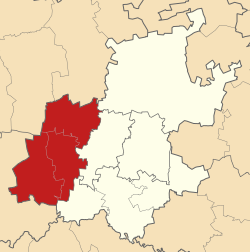 Location in Gauteng | |
| Coordinates: 26°15′S27°30′E / 26.250°S 27.500°E | |
| Country | South Africa |
| Province | Gauteng |
| Seat | Randfontein |
| Local municipalities | |
| Government | |
| • Type | Municipal council |
| • Mayor | Thabiso Bovungana (AIC) |
| Area | |
• Total | 4,087 km2 (1,578 sq mi) |
| Population (2011) [2] | |
• Total | 820,995 |
| • Density | 200/km2 (520/sq mi) |
| Racial makeup (2011) | |
| • Black African | 79.2% |
| • Coloured | 2.5% |
| • Indian/Asian | 1.1% |
| • White | 16.7% |
| First languages (2011) | |
| • Tswana | 27.3% |
| • Afrikaans | 16.9% |
| • Xhosa | 14.9% |
| • Sotho | 10.8% |
| • Other | 30.1% |
| Time zone | UTC+2 (SAST) |
| Municipal code | DC48 |
The West Rand District Municipality (Tswana : Mmasepala wa Sedika wa West Rand; Afrikaans : Wesrand-distriksmunisipaliteit; Xhosa : uMasipala weSithili sase West Rand; Sotho : Masepala wa Setereke wa West Rand) [1] is one of the districts of the Gauteng province of South Africa, that covers the West Rand area, with the exception of Roodepoort. The seat of the district municipality is Randfontein. [3] [4] As of 2011, the most spoken language among its population of 820,995 is Tswana. The district code is CBDC8.

