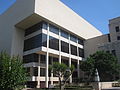
The Gregg County Courthouse of Art Deco design in Longview designed by architects Voelcker and Dixon.[1] William R. Hughes was the county judge when the structure was completed in 1932.
Gregg County is part of the Longview, Texas metropolitan area and the Longview–Marshall, Texas combined statistical area. Discovery of oil near Kilgore in October 1930 was the beginning of an oil boom that attracted workers to the county and expanded the population by more than 500% by 1940, according to the census. By that time, the economy had stabilized, but the East Texas Oil Field, extending into five counties, has continued to be important to the county and region's economy.
This area was among early sections settled by United States immigrants before Texas became an independent republic, and after 1845, a state of the United States. It was an area developed as cotton plantations dependent on slave labor of African Americans. Lumbering of the pine forests was also pursued, especially in the early years of clearing the land for cultivation.
Gregg County was organized in 1873 after the American Civil War from portions of existing counties. When the Texas State Legislature convened in January 1873, Democratic representative B. W. Brown of Upshur County introduced a bill to create a new county from parts of Harrison, Rusk, and Upshur Counties. He was likely trying to break up the black majority that dominated county politics in Harrison County. Under Brown's proposal, the county was to be named Roanoke, and Longview was to be the county seat. The proposed name was later changed to honor Texas leader and Confederate General John Gregg, and the county seat was determined by popular election.
Harrison and Rusk Counties resisted efforts to have portions of their territory assigned to Gregg County. When Gregg County was created, it first consisted of about 143 square miles (370km2) taken from Upshur County, and the Sabine River was its southern boundary. In April 1874, about 141 square miles (370km2) south of the Sabine River in Rusk County was added to Gregg County. The third portion, of about 145 square miles (380km2) to be taken from Harrison County, was never realized. Many of its voters continued to elect Republicans to county offices.
By 1919, the county population was 16,700, of whom 8,160, or 48%, were Black. Most were sharecroppers or tenant farmers raising cotton as a commodity crop. Members of the Negro Business League set up a cooperative store in Longview to compete with White merchants and offer African-American residents more choices for purchases. Beginning July 10, the town had a short-lived Longview Race Riot, in which one Black man was killed, and several Black-owned homes and properties were burned. It was quelled when the sheriff asked for Texas National Guard and other law enforcement. They established a curfew and military occupation.[5][6]
Agricultural work declined during the Great Depression of the 1930s, and many African Americans continued to leave in the Great Migration north to find other work.
In October 1930, oil was discovered near Joinerville, between Henderson, Texas (Rusk County) and Kilgore (mostly in southwest Gregg County). And shortly after, oil was discovered within Gregg County, near Pine Tree/East Mountain (Lathrop No 1). Suddenly, the county economy was booming, and the East Texas Oil Field attracted so many workers that county population increased by more than 500% by 1940. Growth stabilized, but oil has continued to be important. County demographics changed as other workers were attracted to the area. In the early 21st century, slightly less than 20% of the population is African American.
Geography
According to the U.S. Census Bureau, the county has a total area of 276 square miles (710km2), of which 2.5 square miles (6.5km2) (0.9%) are covered by water.[7]
Gregg County, Texas – racial and ethnic composition Note: the US Census treats Hispanic/Latino as an ethnic category. This table excludes Latinos from the racial categories and assigns them to a separate category. Hispanics/Latinos may be of any race.
As of the 2020 census, the county had a population of 124,239. The median age was 37.5 years; 24.3% of residents were under the age of 18 and 17.0% were 65 years of age or older. For every 100 females there were 93.4 males, and for every 100 females age 18 and over there were 89.8 males age 18 and over.[16]
86.5% of residents lived in urban areas, while 13.5% lived in rural areas.[18]
There were 48,130 households in the county, of which 32.5% had children under the age of 18 living in them. Of all households, 44.3% were married-couple households, 18.5% were households with a male householder and no spouse or partner present, and 31.3% were households with a female householder and no spouse or partner present. About 28.7% of all households were made up of individuals and 12.1% had someone living alone who was 65 years of age or older. There were 53,212 housing units, of which 9.6% were vacant. Among occupied housing units, 58.9% were owner-occupied and 41.1% were renter-occupied. The homeowner vacancy rate was 1.9% and the rental vacancy rate was 10.4%.[16]
2000 census
According to the 2000 census, 111,379 people, 42,687 households, and 29,667 families were residing in the county.[19] The population density was 406 inhabitants per square mile (157/km2) in 2000; the 46,349 housing units averaged 169 per square mile (65/km2).
The racial makeup of the county was 72.89% White, 19.86% African American, 0.52% Native American, 0.68% Asian, 4.57% from other races, and 1.49% from two or more races; about 9.14% of the population was Hispanic or Latino of any race.[15]
In 2000, median income for a household in the county was $35,006, and for a family was $42,617. Males had a median income of $33,186 versus $21,432 for females. The per capita income for the county was $18,449. About 12.00% of families and 15.10% of the population were below the poverty line, including 20.50% of those under age 18 and 11.40% of those age 65 or over.
Income
By 2020, its median household income was $52,027 with a mean income of $73,022.[20]
Areas in Gladewater, Kilgore, Longview, Pine Tree, Sabine, Spring Hill, and White Oak ISDs (in other words, all of the school districts covering sections of the county) are in the Kilgore Junior College zone.[22]
Gregg subsequently became a classic "Solid South" Democratic county between 1904 and 1948, but has since become solidly Republican at a Presidential level, although the presence of a sizeable black population has permitted the Democrats to gain a quarter of the countywide total at virtually every election. Nonetheless, Gregg was one of only 16 Texas counties to vote for Barry Goldwater in his 1964 definitive loss, and the last Democrat to carry the county was Harry S. Truman in 1948.
United States presidential election results for Gregg County, Texas[25]
This page is based on this Wikipedia article Text is available under the CC BY-SA 4.0 license; additional terms may apply. Images, videos and audio are available under their respective licenses.