Stonewall County, Texas

Last updated

Stonewall County
Stonewall County Courthouse September 2020.jpg
Stonewall County Courthouse in Aspermont
Map of Texas highlighting Stonewall County.svg
Location within the U.S. state of Texas
Texas in United States.svg
Texas's location within the U.S.
Coordinates: 33°11′N100°15′W / 33.18°N 100.25°W / 33.18; -100.25
CountryFlag of the United States.svg United States
StateFlag of Texas.svg Texas
Founded1888
Named after Stonewall Jackson
Seat Aspermont
Largest townAspermont
Area
  Total
920 sq mi (2,400 km2)
  Land916 sq mi (2,370 km2)
  Water3.9 sq mi (10 km2)  0.4%
Population
 (2020)
  Total
1,245
  Density1.4/sq mi (0.52/km2)
Time zone UTC−6 (Central)
  Summer (DST) UTC−5 (CDT)
Congressional district 19th

Stonewall County is a county located in the U.S. state of Texas. As of the 2020 census, its population was 1,245. [1] Its county seat is Aspermont. [2] The county was created in 1876 and organized in 1888. [3] It is named for Stonewall Jackson, a general of the Confederate States Army.

Contents

History

Stonewall County was formed in 1876 from the Young Territory. It was initially attached to Young County, Throckmorton County, and then Jones County, before finally becoming fully organized in 1889. [4]

Geography

According to the U.S. Census Bureau, the county has a total area of 920 square miles (2,400 km2), of which 3.9 square miles (10 km2) (0.4%) are covered by water. [5]

Geographic features

Adjacent counties

Demographics

Historical population
CensusPop.Note
1880 104
1890 1,024884.6%
1900 2,183113.2%
1910 5,320143.7%
1920 4,086−23.2%
1930 5,66738.7%
1940 5,589−1.4%
1950 3,679−34.2%
1960 3,017−18.0%
1970 2,397−20.6%
1980 2,4060.4%
1990 2,013−16.3%
2000 1,693−15.9%
2010 1,490−12.0%
2020 1,245−16.4%
U.S. Decennial Census [9]
1850–2010 [10] 2010 [11] 2020 [12]
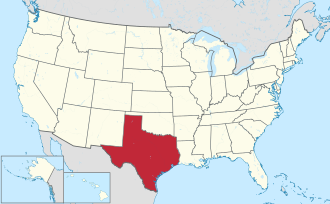
Stonewall County, Texas – Racial and ethnic composition
Note: the US Census treats Hispanic/Latino as an ethnic category. This table excludes Latinos from the racial categories and assigns them to a separate category. Hispanics/Latinos may be of any race.
Race / Ethnicity (NH = Non-Hispanic)Pop 2010 [11] Pop 2020 [12] % 2010% 2020
White alone (NH)1,20695880.94%76.95%
Black or African American alone (NH)38182.55%1.45%
Native American or Alaska Native alone (NH)430.27%0.24%
Asian alone (NH)1450.94%0.40%
Pacific Islander alone (NH)000.00%0.00%
Other race alone (NH)020.00%0.16%
Mixed or multiracial (NH)19331.28%2.65%
Hispanic or Latino (any race)20922614.03%18.15%
Total1,4901,245100.00%100.00%

As of the 2010 census, [13] 1,490 people, 642 households, and 426 families resided in the county. The population density was 2.0 people per square mile (0.77 people/km2). The 928 housing units averaged 1 unit per square mile (0.39 units/km2). The racial makeup of the county was 87.7% White, 2.6% Black or African American, 0.5% Native American, 0.9% Asian, 6.3% from other races, and 1.9% from two or more races. About 14.0% of the population was Hispanic or Latino of any race.

Of the 642 households, 24% had children under 18 living with them, 53% were married couples living together, 10.1% had a female householder with no husband present, and 33.6% were not families; 15.7% had someone living alone who was 65 or older. The average household size was 2.28 and the average family size was 2.83.

In the county, the population was distributed as 22.8% under 18, 6.2% from 18 to 24, 22.6% from 25 to 44, 24.5% from 45 to 64, and 24.0% who were 65 or older. The median age was 44 years. For every 100 females, there were 90.0 males. For every 100 females 18 and over, there were 91.1 males.

The median income for a household in the county was $27,935, and for a family was $35,571. Males had a median income of $27,083 versus $15,000 for females. The per capita income for the county was $16,094. About 14.80% of families and 19.30% of the population were below the poverty line, including 31.50% of those under 18 and 14.50% of those 65 or over.

Communities

Town

Unincorporated communities

Ghost town

Transportation

Major highways

Air

The county is served by Stonewall County Airport, a public airport located in Aspermont, 1 nautical mile (1.9 km) northeast of the central business district. [14]

Politics

Whereas the counties to its north in the Panhandle proper became overwhelmingly Republican at the presidential level with Dwight D. Eisenhower in the 1950s, Stonewall County continued to favor the Democratic Party for another four decades, even being narrowly won by Walter Mondale in 1984 when he came within 3,819 votes of losing all fifty states. During the twentieth century the only Republican to carry Stonewall County was Richard Nixon in 1972 – it was one of the few Baptist Bible Belt counties that stayed loyal to the anti-Prohibition Catholic Al Smith in 1928 when Texas voted Republican for the first time in its history.

Like the rest of the Bible Belt, due to opposition to the Democratic Party's liberal positions on social issues Stonewall County has trended powerfully Republican [15] and in the last five elections the Republican nominee has won more than 62 percent of the vote – more than Nixon won in his 3,000-plus-county landslide in 1972.

Republican Drew Springer, Jr., a businessman from Muenster in Cooke County, represented Stonewall County in the Texas House of Representatives from January 2013, and as of January 2021, represents District 30 in the Texas Senate. [16]

United States presidential election results for Stonewall County, Texas [17]
Year Republican Democratic Third party(ies)
No.%No.%No.%
1912 71.46%34171.19%13127.35%
1916 213.27%50278.19%11918.54%
1920 13424.50%35665.08%5710.42%
1924 17116.03%77872.91%11811.06%
1928 44246.92%50053.08%00.00%
1932 504.87%97695.13%00.00%
1936 595.56%1,00194.34%10.09%
1940 15611.75%1,17288.25%00.00%
1944 898.24%90283.52%898.24%
1948 656.11%96890.98%312.91%
1952 31927.57%83672.26%20.17%
1956 30626.89%82972.85%30.26%
1960 30626.09%86473.66%30.26%
1964 21918.27%97881.57%20.17%
1968 21319.19%63557.21%26223.60%
1972 66261.58%39436.65%191.77%
1976 25223.55%81275.89%60.56%
1980 48840.03%71958.98%120.98%
1984 59948.15%64351.69%20.16%
1988 42136.70%72463.12%20.17%
1992 24221.51%56149.87%32228.62%
1996 32335.22%48753.11%10711.67%
2000 49662.08%29436.80%91.13%
2004 49966.36%25033.24%30.40%
2008 52471.29%20628.03%50.68%
2012 50775.11%16023.70%81.19%
2016 55579.17%13519.26%111.57%
2020 61583.56%11615.76%50.68%
2024 60484.36%11015.36%20.28%
United States Senate election results for Stonewall County, Texas1 [18]
Year Republican Democratic Third party(ies)
No.%No.%No.%
2024 58181.60%12016.85%111.54%

Education

School districts include: [19]

The Texas Legislature designated the county as being in the Western Texas College District. [20]

References

  1. "Stonewall County, Texas". United States Census Bureau . Retrieved January 30, 2022.
  2. "Find a County". National Association of Counties. Retrieved June 7, 2011.
  3. "Texas: Individual County Chronologies". Texas Atlas of Historical County Boundaries. The Newberry Library. 2008. Retrieved May 26, 2015.
  4. "TX: Individual County Chronologies". Archived from the original on February 16, 2018. Retrieved June 18, 2020.
  5. "2010 Census Gazetteer Files". United States Census Bureau. August 22, 2012. Retrieved May 10, 2015.
  6. "Stonewall County High Point Trip Report" . Retrieved August 14, 2008.
  7. "Prominence Ladder from Double Mountains" . Retrieved August 14, 2008.
  8. U.S. Geological Survey Geographic Names Information System: Brazos River
  9. "Decennial Census of Population and Housing by Decades". US Census Bureau.
  10. "Texas Almanac: Population History of Counties from 1850–2010" (PDF). Texas Almanac. Archived (PDF) from the original on October 9, 2022. Retrieved May 10, 2015.
  11. 1 2 "P2 Hispanic or Latino, and Not Hispanic or Latino by Race – 2010: DEC Redistricting Data (PL 94-171) – Stonewall County, Texas". United States Census Bureau .
  12. 1 2 "P2 Hispanic or Latino, and Not Hispanic or Latino by Race – 2020: DEC Redistricting Data (PL 94-171) – Stonewall County, Texas". United States Census Bureau .
  13. "U.S. Census website". United States Census Bureau . Retrieved May 14, 2011.
  14. FAA Airport Form 5010 for T60 PDF . Federal Aviation Administration, Effective 24 May 2018.
  15. Cohn, Nate; ‘Demographic Shift: Southern Whites’ Loyalty to G.O.P. Nearing That of Blacks to Democrats’, New York Times , April 24, 2014
  16. "State Rep. Springer announces district tour July 30". Lubbock Avalanche-Journal, July 16, 2013. Retrieved July 18, 2013.
  17. Leip, David. "Dave Leip's Atlas of U.S. Presidential Elections". uselectionatlas.org. Retrieved April 11, 2018.
  18. "2024 Senate Election (Official Returns)". Commonwealth of Texas by county. November 5, 2024. Retrieved December 5, 2024.
  19. "2020 CENSUS - SCHOOL DISTRICT REFERENCE MAP: Stonewall County, TX" (PDF). U.S. Census Bureau . Retrieved September 22, 2024. - Text list
  20. "Sec. 130.210. WESTERN TEXAS COLLEGE DISTRICT SERVICE AREA" . Retrieved September 22, 2024.

33°11′N100°15′W / 33.18°N 100.25°W / 33.18; -100.25