Cooke County, Texas

Last updated

Cooke County
Cooke county tx courthouse 2015.jpg
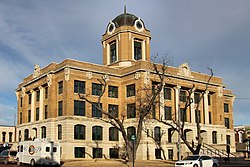
The Cooke County Courthouse in Gainesville
Flag of Cooke County, Texas.svg
Map of Texas highlighting Cooke County.svg
Location within the U.S. state of Texas
Texas in United States.svg
Texas's location within the U.S.
Coordinates: 33°38′00″N97°13′00″W / 33.633333333333°N 97.216666666667°W / 33.633333333333; -97.216666666667
CountryFlag of the United States.svg United States
StateFlag of Texas.svg Texas
Founded1849
Seat Gainesville
Largest cityGainesville
Area
  Total
898 sq mi (2,330 km2)
  Land875 sq mi (2,270 km2)
  Water24 sq mi (60 km2)  2.6%
Population
 (2020)
  Total
41,668
  Density46/sq mi (18/km2)
Time zone UTC−6 (Central)
  Summer (DST) UTC−5 (CDT)
Congressional district 26th
Website www.co.cooke.tx.us

Cooke County is a county in the U.S. state of Texas. At the 2020 census, its population was 41,668. [1] [2] The county seat is Gainesville. [3] The county was founded in 1848 and organized the next year. It is named for William Gordon Cooke, a soldier during the Texas Revolution. It is a part of the Texoma region.

Contents

Cooke County comprises the Gainesville, TX micropolitan statistical area, which is also included in the DallasFort Worth, TX-OK combined statistical area.

Geography

According to the U.S. Census Bureau, the county has an area of 898 square miles (2,330 km2), of which 24 square miles (62 km2) (2.6%) are covered by water. [4]

Major highways

Adjacent counties

Demographics

Historical population
CensusPop.Note
1850 220
1860 3,7601,609.1%
1870 5,31541.4%
1880 20,391283.7%
1890 24,69621.1%
1900 27,49411.3%
1910 26,603−3.2%
1920 25,667−3.5%
1930 24,136−6.0%
1940 24,9093.2%
1950 22,146−11.1%
1960 22,5601.9%
1970 23,4714.0%
1980 27,65617.8%
1990 30,77711.3%
2000 36,36318.1%
2010 38,4375.7%
2020 41,6688.4%
2024 (est.)44,258 [5] 6.2%
U.S. Decennial Census [6]
1850–2010 [7] 2010 [8] 2020 [9]
Cooke County, Texas – Racial and ethnic composition
Note: the US Census treats Hispanic/Latino as an ethnic category. This table excludes Latinos from the racial categories and assigns them to a separate category. Hispanics/Latinos may be of any race.
Race / Ethnicity (NH = Non-Hispanic)Pop 2000 [10] Pop 2010 [8] Pop 2020 [9] % 2000% 2010% 2020
White alone (NH)30,82630,25529,40484.77%78.71%70.57%
Black or African American alone (NH)1,0871,0181,1812.99%2.65%2.83%
Native American or Alaska Native alone (NH)3043033600.84%0.79%0.86%
Asian alone (NH)1212783070.33%0.72%0.74%
Pacific Islander alone (NH)119130.00%0.05%0.03%
Other race alone (NH)22351250.06%0.09%0.30%
Mixed race or Multiracial (NH)3755321,7591.03%1.38%4.22%
Hispanic or Latino (any race)3,6275,9978,5199.97%15.60%20.44%
Total36,36338,43741,668100.00%100.00%100.00%

According to statistical data from 2016, Cooke County has a population of 39,141 people (41% urban, 59% rural), nearly 14,000 households, and over 10,000 families. The population density was 42 people per square mile (16 people/km2). The 15,061 housing units averaged 17 units per square mile (6.6/km2). The racial makeup of the county was 88.84% White, 3.06% Black or African American, 1.00% Native American, 0.34% Asian, 0.01% Pacific Islander, 5.16% from other races, and 1.61% from two or more races. About 10% of the population was Hispanic or Latino of any race.

Of the more than 14,000 households in Cooke County, 33.90% had children under the age of 18 living in the home, 59.60% were married couples living together, 9.90% had a female householder with no husband present, and 26.70% were not families; 23.30% of all households were made up of individuals, and 11.10% had someone living alone who was 65 years of age or older. The average household size was 2.60 and the average family size was 3.07.

The population was distributed as 27.30% under the age of 18, 8.70% from 18 to 24, 26.10% from 25 to 44, 23.00% from 45 to 64, and 14.90% who were 65 years of age or older. The median age was 37 years. For every 100 females, there were 97.40 males. For every 100 females age 18 and over, there were 92.80 males.

While 2015 estimates place the median household income for Cooke County at $53,552, past estimates showed the median household income to be $37,649, with the median family income being $44,869. Males had a median income of $32,429 and females $22,065. The per capita income was $17,889. About 10.90% of families and 14.10% of the population were below the poverty line, including 19.80% of those under age 18 and 10.70% of those age 65 or over. Median house values in 2015 were $118,254.

Government and infrastructure

The Texas Juvenile Justice Department operates the Gainesville State School in an unincorporated area in Cooke County, east of Gainesville. [11]

Politics

Cooke County has long voted predominantly Republican; the only Democratic presidential candidate to win Cooke County since 1948 was Lyndon B. Johnson in 1964, in that year's landslide over Barry Goldwater. Cooke County has been included in the Texas's 26th congressional district since 2000, currently represented by Republican Brandon Gill. [12] Republican David Spiller has represented Cooke County in the Texas House of Representatives since winning a special election 2021, [13] while Republican Brent Hagenbuch has served the county within District 30 of the Texas Senate since 2025. [14]

United States presidential election results for Cooke County, Texas [15]
Year Republican Democratic Third party(ies)
No.%No.%No.%
1912 2069.64%1,78083.29%1517.07%
1916 35312.91%2,27383.11%1093.99%
1920 1,00329.60%2,17064.05%2156.35%
1924 52512.85%3,17077.58%3919.57%
1928 2,26253.99%1,92445.92%40.10%
1932 47011.02%3,77588.51%200.47%
1936 68615.62%3,68683.93%200.46%
1940 1,35823.20%4,48376.59%120.21%
1944 91918.61%3,27066.22%74915.17%
1948 1,19423.76%3,24164.48%59111.76%
1952 4,38562.20%2,65737.69%80.11%
1956 4,16464.33%2,27235.10%370.57%
1960 3,98355.50%3,16844.15%250.35%
1964 3,11743.23%4,08356.62%110.15%
1968 3,79947.96%2,71134.22%1,41217.82%
1972 6,31778.28%1,70221.09%510.63%
1976 4,80451.50%4,48348.05%420.45%
1980 6,76062.58%3,84235.57%2001.85%
1984 8,26071.43%3,27828.35%260.22%
1988 7,19662.84%4,21736.82%390.34%
1992 5,29940.50%3,10523.73%4,68035.77%
1996 7,32059.53%3,78230.76%1,1959.72%
2000 10,12875.19%3,15323.41%1881.40%
2004 11,90878.82%3,14220.80%570.38%
2008 11,87178.86%3,05120.27%1320.88%
2012 11,95183.28%2,24615.65%1541.07%
2016 13,18182.61%2,35214.74%4222.64%
2020 15,59681.98%3,21016.87%2191.15%
2024 16,97582.86%3,31016.16%2020.99%
United States Senate election results for Cooke County, Texas1 [16]
Year Republican Democratic Third party(ies)
No.%No.%No.%
2024 16,28480.22%3,62017.83%3951.95%

Communities

Cities

Towns

Census-designated places

Unincorporated communities

Ghost towns

See also

References

  1. "U.S. Census Bureau QuickFacts: Cooke County, Texas". United States Census Bureau. Retrieved January 31, 2022.
  2. "Cooke County, Texas". United States Census Bureau . Retrieved February 23, 2021.
  3. "Find a County". National Association of Counties. Archived from the original on May 31, 2011. Retrieved June 7, 2011.
  4. "2010 Census Gazetteer Files". United States Census Bureau. August 22, 2012. Retrieved April 21, 2015.
  5. "QuickFacts: Cooke County, Texas". United States Census Bureau. Retrieved June 12, 2025.
  6. "Decennial Census of Population and Housing by Decades". US Census Bureau.
  7. "Texas Almanac: Population History of Counties from 1850–2010" (PDF). Texas Almanac. Archived (PDF) from the original on October 9, 2022. Retrieved April 21, 2015.
  8. 1 2 "P2 Hispanic or Latino, and Not Hispanic or Latino by Race – 2010: DEC Redistricting Data (PL 94-171) – Cooke County, Texas". United States Census Bureau .
  9. 1 2 "P2 Hispanic or Latino, and Not Hispanic or Latino by Race – 2020: DEC Redistricting Data (PL 94-171) – Cooke County, Texas". United States Census Bureau .
  10. "P004: Hispanic or Latino, and Not Hispanic or Latino by Race – 2000: DEC Summary File 1 – Cooke County, Texas". United States Census Bureau.
  11. "Gainesville State School Archived 2011-02-20 at the Wayback Machine ." Texas Youth Commission. Retrieved August 8, 2010.
  12. "Texas 26th Congressional District Election Results". New York Times . November 5, 2024.
  13. "Texas House of Representatives District 68". Ballotpedia. Retrieved November 18, 2022.
  14. McPhate, Christian (November 5, 2024). "Former Denton County GOP chair Brent Hagenbuch wins race for Texas Senate District 30". Denton Record-Chronicle. Retrieved November 13, 2024.
  15. Leip, David. "Dave Leip's Atlas of U.S. Presidential Elections". uselectionatlas.org. Retrieved February 21, 2021.
  16. "2024 Senate Election (Official Returns)". Commonwealth of Texas by county. November 5, 2024. Retrieved December 5, 2024.

33°38′N97°13′W / 33.633°N 97.217°W / 33.633; -97.217