List of villages in Canada

Last updated

Memramcook is the largest village in New Brunswick with a population of 4,831 StJosephMemramcook.jpg
Memramcook is the largest village in New Brunswick with a population of 4,831
Casselman is the largest village in Ontario with a population of 3,626 Casselman ON.JPG
Casselman is the largest village in Ontario with a population of 3,626

A village is a type of incorporated municipality within the majority of the provinces and territories of Canada.

Contents

As of January 1, 2012, there were 550 villages among the provinces of Alberta, British Columbia, Manitoba, New Brunswick, the Northwest Territories, Ontario, Quebec, Saskatchewan and Yukon. Since then, Kedgwick in New Brunswick changed to rural community status [2] and New Norway in Alberta dissolved to become an unincorporated hamlet, [3] while both Hepburn and Pense in Saskatchewan changed to town status. [4] Saskatchewan has the highest amount of villages at 264. [4] [5]

Alberta

Alberta had 80 villages as of July 2021. [6]

Name Rural
municipality
[7]
Incorporation
date (village) [8] -->
Population
(2016) [9]
Population
(2011) [9]
Change
(%) [9]
Land
area
(km²) [9]
Population
density
(per km²) [9]
Acme Kneehill County July 7, 19106536530.0%2.48263.3/km2
Alberta Beach Lac Ste. Anne County January 1, 19991,018865+17.7%2.01506.5/km2
Alix Lacombe County June 3, 1907734830−11.6%3.13234.5/km2
Alliance Flagstaff County August 26, 1918154174−11.5%0.51302.0/km2
Amisk Provost No. 52, MD of January 1, 1956204207−1.4%0.76268.4/km2
Andrew Lamont County June 24, 1930425379+12.1%1.17363.2/km2
Arrowwood Vulcan County May 13, 1926207188+10.1%0.75276.0/km2
Barnwell Taber, MD of January 1, 1980947771+22.8%1.51627.2/km2
Barons Lethbridge County May 6, 1910341315+8.3%0.81421.0/km2
Bawlf Camrose County October 12, 1906422403+4.7%0.89474.2/km2
Beiseker Rocky View County February 23, 1921819785+4.3%2.85287.4/km2
Berwyn Peace No. 135, MD of November 28, 1936538526+2.3%1.58340.5/km2
Big Valley Stettler No. 6, County of March 9, 1942346364−4.9%1.86186.0/km2
Bittern Lake [lower-alpha 1] Camrose County November 2, 1904220224−1.8%6.5733.5/km2
Boyle Athabasca County December 31, 1953845916−7.8%7.13118.5/km2
Breton Brazeau County January 1, 1957574496+15.7%1.72333.7/km2
Carbon Kneehill County November 18, 1912454592−23.3%1.99228.1/km2
Carmangay Vulcan County March 4, 1936242367−34.1%1.86130.1/km2
Caroline Clearwater County December 31, 1951512501+2.2%2.04251.0/km2
Champion Vulcan County May 27, 1911317378−16.1%0.89356.2/km2
Chauvin Wainwright No. 61, MD of December 30, 1912335334+0.3%2.24149.6/km2
Chipman Lamont County October 21, 1913274284−3.5%9.6128.5/km2
Clive Lacombe County January 9, 1912715675+5.9%2.17329.5/km2
Clyde Westlock County January 28, 1914430503−14.5%1.31328.2/km2
Consort Special Area No. 4 September 23, 1912729689+5.8%3.05239.0/km2
Coutts Warner No. 5, County of January 1, 1960245277−11.6%1.24197.6/km2
Cowley Pincher Creek No. 9, MD of August 16, 1906209236−11.4%1.37152.6/km2
Cremona Mountain View County January 1, 1955444457−2.8%1.94228.9/km2
Czar Provost No. 52, MD of November 12, 1917202167+21.0%1.12180.4/km2
Delburne Red Deer County January 17, 1913892830+7.5%3.98224.1/km2
Delia [lower-alpha 2] Starland County July 20, 1914216186+16.1%1.33162.4/km2
Donalda Stettler No. 6, County of December 30, 1912219259−15.4%0.99221.2/km2
Donnelly Smoky River No. 130, MD of January 1, 1956342305+12.1%1.31261.1/km2
Duchess Newell, County of May 12, 19211,085992+9.4%1.96553.6/km2
Edberg Camrose County February 4, 1930151168−10.1%0.35431.4/km2
Edgerton Wainwright No. 61, MD of September 11, 1917384317+21.1%2.04188.2/km2
Elnora Red Deer County July 22, 1929298313−4.8%1.47202.7/km2
Empress Special Area No. 2 February 5, 1914135188−28.2%1.5885.4/km2
Foremost Forty Mile No. 8, County of December 31, 1950541526+2.9%2.16250.5/km2
Forestburg Flagstaff County August 21, 1919875831+5.3%2.73320.5/km2
Girouxville Smoky River No. 130, MD of December 31, 1951219266−17.7%0.67326.9/km2
Glendon Bonnyville No. 87, MD of January 1, 1956493486+1.4%1.99247.7/km2
Glenwood Cardston County January 1, 1961316287+10.1%1.37230.7/km2
Halkirk Paintearth No. 18, County of February 10, 1912112121−7.4%0.61183.6/km2
Hay Lakes [lower-alpha 3] Camrose County April 17, 1928495425+16.5%0.59839.0/km2
Heisler Flagstaff County January 1, 1961160151+6.0%0.64250.0/km2
Hill Spring Cardston County January 1, 1961162186−12.9%0.96168.8/km2
Hines Creek Clear Hills County December 31, 1951346380−8.9%5.3364.9/km2
Holden Beaver County April 14, 1909350381−8.1%1.74201.1/km2
Hughenden Provost No. 52, MD of December 27, 1917243230+5.7%0.78311.5/km2
Hussar Wheatland County April 20, 1928190176+8.0%0.75253.3/km2
Innisfree Minburn No. 27, County of March 11, 1911193220−12.3%1.01191.1/km2
Irma Wainwright No. 61, MD of May 30, 1912521457+14.0%1.34388.8/km2
Kitscoty Vermilion River, County of March 22, 1911925846+9.3%1.51612.6/km2
Linden Kneehill County January 1, 1964828725+14.2%2.58320.9/km2
Lomond Vulcan County February 16, 1916166173−4.0%1.21137.2/km2
Longview Foothills County January 1, 19643073070.0%1.1279.1/km2
Lougheed Flagstaff County November 7, 1911256233+9.9%2.1121.9/km2
Mannville Minburn No. 27, County of December 29, 1906828803+3.1%1.64504.9/km2
Marwayne Vermilion River, County of December 31, 1952564612−7.8%1.6352.5/km2
Milo Vulcan County May 7, 193191122−25.4%0.9892.9/km2
Morrin Starland County April 16, 1920240245−2.0%0.67358.2/km2
Munson Starland County May 5, 1911192204−5.9%2.5375.9/km2
Myrnam Two Hills No. 21, County of August 22, 1930339370−8.4%2.79121.5/km2
Nampa Northern Sunrise County January 1, 1958364362+0.6%1.71212.9/km2
Paradise Valley Vermilion River, County of January 1, 1964179174+2.9%0.63284.1/km2
Rockyford Wheatland County March 28, 1919316325−2.8%1.08292.6/km2
Rosalind Camrose County January 1, 1966188190−1.1%0.62303.2/km2
Rosemary Newell, County of December 31, 1951396342+15.8%0.59671.2/km2
Rycroft Spirit River No. 133, MD of March 15, 1944612628−2.5%1.92318.8/km2
Ryley [lower-alpha 4] Beaver County April 2, 1910483497−2.8%2.61185.1/km2
Spring Lake [lower-alpha 5] Parkland County January 1, 1999699533+31.1%2.33300.0/km2
Standard Wheatland County April 29, 1922353379−6.9%2.35150.2/km2
Stirling Warner No. 5, County of September 3, 19019781,090−10.3%2.71360.9/km2
Veteran Special Area No. 4 June 30, 1914207249−16.9%0.84246.4/km2
Vilna Smoky Lake County June 23, 1923290249+16.5%0.96302.1/km2
Warburg Leduc County December 31, 1953766789−2.9%2.68285.8/km2
Warner Warner No. 5, County of November 12, 1908373331+12.7%1.16321.6/km2
Waskatenau Smoky Lake County May 19, 1932186255−27.1%0.6310.0/km2
Youngstown Special Area No. 3 December 31, 1936154178−13.5%1.11138.7/km2
Total villages33,77333,448+1.0%146.85230.0/km2

Notes:

  1. Bittern Lake was formerly known as Rosenroll prior to December 16, 1911. [10]
  2. Delia was formerly known as Highland prior to December 9, 1915. [11]
  3. Hay Lakes was formerly known as Hay Lake prior to January 1, 1932. [12]
  4. Ryley was also known as Equity in 1909. [13]
  5. Spring Lake was formerly known as Edmonton Beach prior to January 1, 1999. [14]

British Columbia

British Columbia had 42 villages as of January 1, 2012. [5]

Villages of British Columbia
NameCorporate name [15] Status [15] Regional
district
[15]
Incorp. date
(village) [15]
Pop.
(2011) [16]
Pop.
(2006) [16]
Change
(%) [16]
Area
(km2) [16]
Pop.
density [16]
Alert Bay Alert Bay, The Corporation of the Village ofVillage Mount Waddington January 14, 1946445456−2.41.73257.3
Anmore Anmore, Village ofVillage Greater Vancouver December 7, 19872,0921,78517.228.2474.1
Ashcroft Ashcroft, The Corporation of the Village ofVillage Thompson-Nicola June 27, 19521,6281,664−2.250.9032.0
Belcarra Belcarra, Village ofVillage Greater Vancouver August 22, 1979644676−4.75.50117.1
Burns Lake Burns Lake, The Corporation of the Village ofVillage Bulkley-Nechako December 6, 19232,0292,107−3.76.59307.7
Cache Creek Cache Creek, Village ofVillage Thompson-Nicola November 28, 19671,0401,0370.310.25101.5
Canal Flats Canal Flats, Village ofVillage East Kootenay June 29, 20047157002.110.8665.8
Chase Chase, Village ofVillage Thompson-Nicola April 22, 19692,4952,4093.63.77662.5
Clinton Clinton, Village ofVillage Thompson-Nicola July 16, 19636365986.47.8980.6
Cumberland Cumberland, The Corporation of the Village ofVillage Comox Valley January 1, 18983,3982,76223.029.00117.2
Daajing Giids [lower-alpha 1] Daajing Giids, Village ofVillage North Coast December 5, 2005944948−0.435.6226.5
Fraser Lake Fraser Lake, Village ofVillage Bulkley-Nechako September 27, 19661,1671,1134.94.07286.9
Fruitvale Fruitvale, The Corporation of the Village ofVillage Kootenay Boundary November 4, 19522,0161,9523.32.71745.3
Gold River Gold River, Village ofVillage Strathcona August 26, 19651,2671,362−7.010.78117.5
Granisle [lower-alpha 2] Granisle, Village ofVillage Bulkley-Nechako June 29, 1971303364−16.841.867.2
Harrison Hot Springs Harrison Hot Springs, Village ofVillage Fraser Valley May 27, 19491,4681,573−6.75.57263.5
Hazelton Hazelton, The Corporation of the Village ofVillage Kitimat-Stikine February 15, 1956300 [19] 2932.42.80107.1
Kaslo Kaslo, Village ofVillage Central Kootenay August 14, 18931,0261,072−4.32.48413.6
Keremeos Keremeos, The Corporation of the Village ofVillage Okanagan-Similkameen October 30, 19561,3301,2893.22.09635.4
Lions Bay Lions Bay, Village ofVillage Greater Vancouver December 17, 19701,3181,328−0.82.53520.2
Lumby Lumby, The Corporation of the Village ofVillage North Okanagan December 20, 19551,7311,6345.95.74301.6
Lytton Lytton, The Corporation of the Village ofVillage Thompson-Nicola May 3, 1945228235−3.06.5434.8
Masset Masset, Village ofVillage North Coast May 11, 1961884940−6.020.6142.9
McBride McBride, The Corporation of the Village ofVillage Fraser-Fort George April 7, 1932586660−11.24.64126.4
Midway Midway, Village ofVillage Kootenay Boundary May 25, 19676746218.512.2455.0
Montrose Montrose, The Corporation of the Village ofVillage Kootenay Boundary June 22, 19561,0301,0121.81.46704.6
Nakusp Nakusp, Village ofVillage Central Kootenay November 24, 19641,5691,5243.08.05194.8
New Denver New Denver, The Corporation of the Village ofVillage Central Kootenay January 12, 1929504512−1.60.87579.6
Pemberton Pemberton, Village ofVillage Squamish-Lillooet July 20, 19562,3692,1928.110.89217.5
Port Alice Port Alice, Village ofVillage Mount Waddington June 16, 1965805821−1.97.04114.4
Port Clements Port Clements, Village ofVillage North Coast December 31, 1975378440−14.113.0429.0
Pouce Coupe Pouce Coupe, The Corporation of the Village ofVillage Peace River January 6, 1932738739−0.12.06358.5
Radium Hot Springs Radium Hot Springs, Village ofVillage East Kootenay December 10, 19907777355.76.34122.5
Salmo Salmo, The Corporation of the Village ofVillage Central Kootenay October 30, 19461,1391,00713.12.44466.2
Sayward Sayward, Village ofVillage Strathcona June 27, 1968317341−7.04.5170.3
Silverton Silverton, The Corporation of the Village ofVillage Central Kootenay May 6, 19301951855.40.35550.5
Slocan Slocan, Village ofVillage Central Kootenay June 1, 1901296314−5.70.78381.7
Tahsis Tahsis, Village ofVillage Strathcona June 17, 1970316366−13.75.2660.0
Telkwa Telkwa, The Corporation of the Village ofVillage Bulkley-Nechako July 18, 19521,3501,2954.27.04191.9
Valemount Valemount, Village ofVillage Fraser-Fort George December 13, 19621,0201,0180.25.17197.4
Warfield Warfield, The Corporation of the Village ofVillage Kootenay Boundary December 8, 19521,7001,729−1.71.89900.7
Zeballos Zeballos, The Corporation of the Village ofVillage Strathcona June 27, 1952125189−33.91.5680.3

Notes:

  1. Daajing Giids was formerly known as Queen Charlotte prior to July 13, 2022. [17]
  2. Granisle was founded as a company town by Granisle Copper Ltd. prior to its incorporation in 1971. [18]

Manitoba

Manitoba had 19 villages as of January 1, 2012. [5]

Villages of Manitoba
NamePopulation
(2016) [20]
Population
(2011) [20]
Change
(%) [20]
Area
(km²) [20]
Population
density [20]
Dunnottar 7636968.72.8272.5
St-Pierre-Jolys 1,1701,0996.52.6450.0
Total villages1,9331,7957.75.4358.0
NameDissolvedCurrently part of
Benito January 1, 2015 Municipality of Swan Valley West
Binscarth January 1, 2015 Municipality of Russell – Binscarth
Bowsman January 1, 2015 Municipality of Minitonas – Bowsman
Cartwright January 1, 2015 Cartwright – Roblin Municipality
Crystal City January 1, 2015 Municipality of Louise
Elkhorn January 1, 2015 Rural Municipality of Wallace – Woodworth
Ethelbert January 1, 2015 Municipality of Ethelbert
Foxwarren January 1, 1967 [21] Prairie View Municipality
Garson January 1, 2003 [22] Rural Municipality of Brokenhead
Glenboro January 1, 2015 Municipality of Glenboro – South Cypress
Great FallsJanuary 1, 1973 [23] Rural Municipality of Alexander
McCreary January 1, 2015 Municipality of McCreary
Napinka January 1, 1986 Municipality of Brenda – Waskada
Notre Dame de Lourdes January 1, 2015 Notre-Dame-de-Lourdes, Manitoba
Powerview May 1, 2005 [24] Town of Powerview-Pine Falls
Riverton January 1, 2015 Municipality of Bifrost – Riverton
St. Claude January 1, 2015 Rural Municipality of Grey
St. Lazare January 1, 2015 Rural Municipality of Ellice – Archie
Somerset January 1, 2015 Municipality of Lorne
Waskada January 1, 2015 Municipality of Brenda – Waskada
Wawanesa January 1, 2015 Municipality of Oakland – Wawanesa
Winnipegosis January 1, 2015 Rural Municipality of Mossey River

New Brunswick

New Brunswick had 65 villages as of July 1, 2012. [5] [2]

Villages of New Brunswick
NameMunicipal type County [25] Incorporation
date [26]
2021 Census of Population [25]
Population
(2021)
Population
(2016)
Change
Land area
(km2)
Population
density
(/km2)
Alma Village Albert 1966282213+32.4%47.645.9
Aroostook Village Victoria 1966313306+2.3%2.23140.4
Atholville Village Restigouche 19663,2903,570−7.8%119.5827.5
Balmoral Village Restigouche 19721,6031,674−4.2%43.3337.0
Bas-Caraquet Village Gloucester 19661,3111,305+0.5%30.9342.4
Bath Village Carleton 1966440476−7.6%2.00220.0
Belledune Village Restigouche 19681,3251,417−6.5%189.187.0
Bertrand Village Gloucester 19681,1531,166−1.1%57.0120.2
Blacks Harbour Village Charlotte 1972907894+1.5%9.02100.6
Blackville Village Northumberland 1966914958−4.6%20.9743.6
Cambridge-Narrows Village Queens 1966715562+27.2%106.796.7
Canterbury Village York 1966320336−4.8%5.3260.2
Cap-Pelé Village Westmorland 19692,503 [27] 2,425+3.2%22.96109.0
Centreville Village Carleton 1966508557−8.8%2.67190.3
Charlo Village Restigouche 19661,3231,310+1.0%31.4542.1
Chipman Village Queens 19661,2011,104+8.8%19.0063.2
Doaktown Village Northumberland 1966808792+2.0%29.0927.8
Dorchester Village Westmorland 19669061,096−17.3%5.71158.7
Drummond Village Victoria 1967729737−1.1%8.8882.1
Eel River Crossing Village Restigouche 19661,8441,953−5.6%65.2628.3
Fredericton Junction Village Sunbury 1966719704+2.1%23.8530.1
Gagetown Village Queens 1966787711+10.7%49.3216.0
Grand Manan Village Charlotte 19952,5952,360+10.0%150.5617.2
Grande-Anse Village Gloucester 1968731899−18.7%24.2730.1
Harvey Village York 1966402358+12.3%2.46163.4
Hillsborough Village Albert 19661,3481,277+5.6%12.81105.2
Lac Baker Village Madawaska 1967685690−0.7%37.2418.4
Le Goulet Village Gloucester 1986749793−5.5%5.40138.7
Maisonnette Village Gloucester 1986535495+8.1%12.9141.4
McAdam Village York 19661,1731,151+1.9%14.1982.7
Meductic Village York 1966180215−16.3%6.2628.8
Memramcook Village Westmorland 19955,0294,778+5.3%186.6426.9
Millville Village York 1966274273+0.4%12.1422.6
Minto Village Queens 19662,2342,305−3.1%31.3671.2
Neguac Village Northumberland 19671,6921,684+0.5%26.7263.3
New Maryland Village York 19914,1534,174−0.5%21.25195.4
Nigadoo Village Gloucester 1967997963+3.5%7.65130.3
Norton Village Kings 19661,4101,382+2.0%75.3518.7
Paquetville Village Gloucester 1966718720−0.3%9.2677.5
Perth-Andover Village Victoria 19661,5741,590−1.0%8.96175.7
Petitcodiac Village Westmorland 19661,4761,383+6.7%17.1885.9
Petit-Rocher Village Gloucester 19661,9541,897+3.0%4.52432.3
Plaster Rock Village Victoria 19661,0021,023−2.1%3.01332.9
Pointe-Verte Village Gloucester 1966865886−2.4%13.7662.9
Port Elgin Village Westmorland 1922381408−6.6%2.65143.8
Rexton Village Kent 1966874830+5.3%6.29139.0
Riverside-Albert Village Albert 1966348350−0.6%3.39102.7
Rivière-Verte Village Madawaska 1966744724+2.8%6.91107.7
Rogersville Village Northumberland 19661,1931,166+2.3%7.19165.9
Saint-Antoine Village Kent 1966 [lower-alpha 1] 1,7911,733+3.3%6.32283.4
Sainte-Anne-de-Madawaska Village Madawaska 1966891957−6.9%8.9799.3
Sainte-Marie-Saint-Raphaël Village Gloucester 1966820879−6.7%15.8451.8
Saint-Isidore Village Gloucester 1978810764+6.0%22.9435.3
Saint-Léolin Village Gloucester 1966615647−4.9%19.7331.2
Saint-Louis de Kent Village Kent 1986981856+14.6%1.98495.5
Salisbury Village Westmorland 19662,3872,284+4.5%13.56176.0
St. Martins Village Saint John 1966320276+15.9%2.35136.2
Stanley Village York 1966397412−3.6%16.9323.4
Sussex Corner Village Kings 19661,4581,461−0.2%9.32156.4
Tide Head Village Restigouche 1966951938+1.4%19.3449.2
Tracy Village Sunbury 1966610608+0.3%29.4420.7
  1. Incorporated as St. Anthony but the name was changed to Saint-Antoine in 1969. [26]

Newfoundland and Labrador

Newfoundland and Labrador did not have any incorporated villages as of January 1, 2012. [5]

Northwest Territories

The Northwest Territories had one village as of January 1, 2012. [5]

NamePopulation
(2011) [28]
Population
(2006) [28]
Change
(%) [28]
Area
(km2) [28]
Population
density [28]
Fort Simpson 1,2381,2161.878.3215.8

Nova Scotia

In November 2014 Nova Scotia had 22 incorporated villages according to the Union of Nova Scotia Municipalities. The County of Kings had the largest number (7). In a draft fiscal report a recommendation was made to phase out all villages.

Nunavut

Nunavut did not have any incorporated villages as of January 1, 2012. [5]

Ontario

Ontario had 11 villages as of January 1, 2012. [5]

Villages of Ontario
Village [1] [29] Municipal
status [30]
Geographic area [30] Population
(2016) [1]
Population
(2011) [1]
Change
(%) [29]
Area
(km²) [29]
Population
density [29]
Burk's Falls Single-tierParry Sound9819671.43.07319.2
Casselman Lower-tierPrescott and Russell3,5483,626−2.25.12693.4
Hilton Beach Single-tierAlgoma17114517.92.6265.2
Merrickville-Wolford Lower-tierLeeds and Grenville3,0672,8507.6214.5514.3
Newbury Lower-tierMiddlesex4664474.31.77263.3
Oil Springs Lower-tierLambton648704−8.08.1979.1
Point Edward Lower-tierLambton2,0372,0340.13.28620.6
South River Single-tierParry Sound1,1141,0496.24.15268.3
Sundridge Single-tierParry Sound961985−2.42.30417.6
Thornloe Single-tierTimiskaming112123−8.96.5917.0
Westport Lower-tierLeeds and Grenville590628−6.11.68350.8
Total13,69513,5583.1253.3254.06

Prince Edward Island

Prince Edward Island did not have any incorporated villages as of January 1, 2012. [5]

Quebec

Quebec had 44 villages as of January 1, 2013. [5]

Villages of Quebec
Village municipality Regional county
municipality
Area
(km²)
Population
(2006)
Abercorn Brome-Missisquoi 27.84358
Ayer's Cliff Memphrémagog 11.151076
Baie-Trinité Manicouagan 536.33512
Brome Brome-Missisquoi 11.75274
Chute-aux-Outardes Manicouagan 8.311811
Fort-Coulonge Pontiac 3.441495
Godbout Manicouagan 204.34341
Grandes-Piles Mékinac 115.38358
Grenville Argenteuil 3.051398
Hébertville-Station Lac-Saint-Jean-Est 33.281250
Hemmingford Les Jardins-de-Napierville 0.85771
Kingsbury Le Val-Saint-François 6.2692
Lac-Poulin Beauce-Sartigan 1.08139
Lac-Saguay Antoine-Labelle 176.26496
La Guadeloupe Beauce-Sartigan 31.671740
Laurier-Station Lotbinière 12.432444
Lawrenceville Le Val-Saint-François 17.40659
Marsoui La Haute-Gaspésie 182.95331
Massueville Pierre-De Saurel 1.29504
Mont-Saint-Pierre La Haute-Gaspésie 60.45220
North Hatley Memphrémagog 3.23731
Notre-Dame-du-Bon-Conseil Drummond 4.221388
Pointe-aux-Outardes Manicouagan 71.561479
Pointe-des-Cascades Vaudreuil-Soulanges 2.661127
Pointe-Fortune Vaudreuil-Soulanges 9.09501
Pointe-Lebel Manicouagan 91.161975
Portage-du-Fort Pontiac 4.24294
Price La Mitis 2.351782
Roxton Falls Acton 5.251342
Saint-André-du-Lac-Saint-Jean Le Domaine-du-Roy 157.75461
Saint-Célestin Nicolet-Yamaska 1.61788
Saint-Noël La Matapédia 45.68477
Saint-Pierre Joliette 10.60303
Sainte-Jeanne-d'Arc Maria-Chapdelaine 270.881143
Sainte-Madeleine Les Maskoutains 5.302240
Sainte-Pétronille L'Île-d'Orléans 4.501078
Senneville none7.84958
Stukely-Sud Memphrémagog 66,31962
Tadoussac La Haute-Côte-Nord 74.59872
Tring-Jonction Robert-Cliche 25.711377
Val-David Les Laurentides 43.174284
Vaudreuil-sur-le-Lac Vaudreuil-Soulanges 1.731374
Warden La Haute-Yamaska 5.28376

Saskatchewan

Saskatchewan had 264 villages as of October 24, 2012. [5] [4]

Villages of Saskatchewan
NameIncorporation
date [31]
Rural
municipality [32]
Population
(2016) [33]
Population
(2011) [33]
Change
(%) [33]
Land
area
(km²) [33]
Population
density
(per km²) [33]
Abbey September 2, 1913 Miry Creek No. 229 142115+23.5%0.77184.4/km2
Abernethy July 26, 1904 Abernethy No. 186 204196+4.1%1.03198.1/km2
Albertville January 1, 1986 Wise Creek No. 77 86140−38.6%1.1276.8/km2
Alida February 19, 1926 Reciprocity No. 32 120131−8.4%0.37324.3/km2
Alvena July 1, 1936 Fish Creek No. 402 6055+9.1%0.43139.5/km2
Annaheim April 1, 1977 St. Peter No. 369 210219−4.1%0.78269.2/km2
Archerwill January 1, 1947 Barrier Valley No. 397 166200−17.0%0.83200.0/km2
Arran September 21, 1916 Livingston No. 331 2540−37.5%0.6936.2/km2
Atwater August 12, 1910 Fertile Belt No. 183 3031−3.2%1.7916.8/km2
Avonlea February 10, 1912 Elmsthorpe No. 100 393398−1.3%0.96409.4/km2
Aylesbury March 31, 1910 Craik No. 222 4042−4.8%1.2831.3/km2
Aylsham August 4, 1947 Nipawin No. 487 6571−8.5%0.48135.4/km2
Bangor June 8, 1911 Fertile Belt No. 183 3846−17.4%1.6523.0/km2
Beatty March 31, 1921 Flett's Springs No. 429 6063−4.8%0.8273.2/km2
Beechy May 11, 1925 Victory No. 226 228239−4.6%1.06215.1/km2
Belle Plaine August 12, 1910 Pense No. 160 8566+28.8%1.3463.4/km2
Bethune August 2, 1912 Dufferin No. 190 399405−1.5%2.38167.6/km2
Bjorkdale April 1, 1968 Bjorkdale No. 426 201199+1.0%1.39144.6/km2
Bladworth July 27, 1906 McCraney No. 282 6560+8.3%0.8477.4/km2
Borden July 19, 1907 Great Bend No. 405 287245+17.1%0.76377.6/km2
Bracken January 4, 1926 Lone Tree No. 18 2030−33.3%0.633.3/km2
Bradwell December 26, 1912 Blucher No. 343 166230−27.8%0.42395.2/km2
Briercrest April 17, 1912 Redburn No. 130 159111+43.2%0.62256.5/km2
Brock July 7, 1910 Kindersley No. 290 142127+11.8%0.74191.9/km2
Broderick September 13, 1909 Rudy No. 284 8571+19.7%0.9193.4/km2
Brownlee December 29, 1908 Eyebrow No. 193 5550+10.0%2.4222.7/km2
Buchanan June 11, 1907 Buchanan No. 304 218225−3.1%1.29169.0/km2
Buena Vista November 18, 1983 Lumsden No. 189 612524+16.8%3.61169.5/km2
Bulyea March 9, 1909 McKillop No. 220 113102+10.8%1.2888.3/km2
Cadillac July 2, 1914 Wise Creek No. 77 9278+17.9%1.0587.6/km2
Calder January 18, 1911 Calder No. 241 9097−7.2%0.75120.0/km2
Canwood July 18, 1916 Canwood No. 494 332348−4.6%2.56129.7/km2
Carievale March 14, 1903 Argyle No. 1 240236+1.7%0.88272.7/km2
Caronport January 1, 1988 Caron No. 162 9941,068−6.9%1.9523.2/km2
Ceylon September 26, 1911 The Gap No. 39 11199+12.1%0.75148.0/km2
Chamberlain January 31, 1911 Sarnia No. 221 9088+2.3%0.7128.6/km2
Chaplin October 8, 1912 Chaplin No. 164 229218+5.0%1.26181.7/km2
Christopher Lake March 1, 1985 Lakeland No. 521 289281+2.8%4.5663.4/km2
Clavet July 1, 1978 Blucher No. 343 410386+6.2%0.84488.1/km2
Climax December 11, 1923 Lone Tree No. 18 195182+7.1%1195.0/km2
Coderre August 26, 1925 Rodgers No. 133 30300.0%0.8535.3/km2
Codette March 9, 1929 Nipawin No. 487 198205−3.4%0.37535.1/km2
Coleville July 1, 1953 Oakdale No. 320 305311−1.9%1.87163.1/km2
Conquest October 24, 1911 Fertile Valley No. 285 160176−9.1%1160.0/km2
Consul June 12, 1917 Reno No. 51 7384−13.1%0.65112.3/km2
Craven April 11, 1905 Longlaketon No. 219 214234−8.5%1.21176.9/km2
Creelman April 6, 1906 Fillmore No. 96 113115−1.7%1.1499.1/km2
Debden June 7, 1922 Canwood No. 494 337358−5.9%1.39242.4/km2
Denholm June 25, 1912 Mayfield No. 406 8876+15.8%0.33266.7/km2
Denzil May 3, 1911 Eye Hill No. 382 143135+5.9%0.55260.0/km2
Dilke December 30, 1912 Sarnia No. 221 9877+27.3%1.2876.6/km2
Dinsmore November 3, 1913 Milden No. 286 289318−9.1%2.59111.6/km2
Disley June 24, 1907 Lumsden No. 189 6775−10.7%0.65103.1/km2
Dodsland August 23, 1913 Winslow No. 319 215212+1.4%2.9373.4/km2
Dorintosh January 1, 1989 Meadow Lake No. 588 134147−8.8%0.88152.3/km2
Drake September 19, 1910 Usborne No. 310 197202−2.5%0.72273.6/km2
Drinkwater June 7, 1904 Redburn No. 130 7065+7.7%2.6426.5/km2
Dubuc May 29, 1905 Grayson No. 184 6170−12.9%0.6396.8/km2
Duff May 28, 1920 Stanley No. 215 30300.0%0.22136.4/km2
Duval December 21, 1910 Last Mountain Valley No. 250 8397−14.4%0.75110.7/km2
Dysart April 6, 1909 Lipton No. 217 200218−8.3%1.19168.1/km2
Earl Grey July 27, 1906 Longlaketon No. 219 246239+2.9%1.31187.8/km2
Ebenezer July 1, 1948 Orkney No. 244 185175+5.7%0.62298.4/km2
Edam October 12, 1911 Turtle River No. 469 480444+8.1%1.19403.4/km2
Edenwold October 3, 1912 Edenwold No. 158 233238−2.1%0.68342.6/km2
Elbow April 6, 1909 Loreburn No. 254 337314+7.3%3.9286.0/km2
Elfros December 1, 1909 Elfros No. 307 9096−6.2%2.5235.7/km2
Endeavour April 29, 1953 Preeceville No. 334 6594−30.9%0.9965.7/km2
Englefeld June 13, 1916 St. Peter No. 369 285247+15.4%0.65438.5/km2
Ernfold December 4, 1912 Morse No. 165 1530−50.0%1.1912.6/km2
Eyebrow January 8, 1909 Eyebrow No. 193 119139−14.4%2.744.1/km2
Fairlight October 5, 1909 Maryfield No. 91 40400.0%2.7114.8/km2
Fenwood June 30, 1909 Stanley No. 215 3040−25.0%1.7417.2/km2
Fillmore June 10, 1905 Fillmore No. 96 311255+22.0%1.33233.8/km2
Findlater September 27, 1911 Dufferin No. 190 4550−10.0%1.237.5/km2
Flaxcombe June 4, 1913 Kindersley No. 290 124117+6.0%1.4983.2/km2
Forget November 21, 1904 Tecumseh No. 65 5535+57.1%1.3939.6/km2
Fosston January 1, 1965 Ponass Lake No. 367 4555−18.2%0.5976.3/km2
Fox Valley August 30, 1928 Fox Valley No. 171 249260−4.2%0.6415.0/km2
Frobisher July 4, 1904 Coalfields No. 4 160166−3.6%1.35118.5/km2
Frontier July 10, 1930 Frontier No. 19 372351+6.0%0.93400.0/km2
Gainsborough May 25, 1894 Argyle No. 1 254291−12.7%0.87292.0/km2
Gerald March 25, 1953 Spy Hill No. 152 136114+19.3%0.8170.0/km2
Glaslyn April 16, 1929 Parkdale No. 498 387397−2.5%1.97196.4/km2
Glen Ewen March 24, 1904 Enniskillen No. 3 154144+6.9%2.7755.6/km2
Glenavon April 13, 1910 Chester No. 125 182176+3.4%1.32137.9/km2
Glenside March 30, 1911 Rudy No. 284 7684−9.5%0.7798.7/km2
Golden Prairie April 15, 1942 Big Stick No. 141 3035−14.3%0.4173.2/km2
Goodeve August 18, 1910 Stanley No. 215 4045−11.1%2.6215.3/km2
Goodsoil January 1, 1960 Beaver River No. 622 282281+0.4%1.98142.4/km2
Goodwater May 8, 1911 Lomond No. 37 3025+20.0%0.5950.8/km2
Grayson April 19, 1906 Grayson No. 184 211184+14.7%1.87112.8/km2
Halbrite February 26, 1904 Cymri No. 36 119108+10.2%1.299.2/km2
Harris August 10, 1909 Harris No. 316 193213−9.4%0.72268.1/km2
Hawarden July 16, 1909 Loreburn No. 254 5250+4.0%1.2441.9/km2
Hazenmore August 20, 1913 Pinto Creek No. 75 7050+40.0%0.7395.9/km2
Hazlet January 1, 1963 Pittville No. 169 10695+11.6%0.55192.7/km2
Heward November 21, 1904 Tecumseh No. 65 4440+10.0%0.9944.4/km2
Hodgeville June 22, 1921 Lawtonia No. 135 1721720.0%1.35127.4/km2
Holdfast October 5, 1911 Sarnia No. 221 247169+46.2%1.29191.5/km2
Hubbard June 11, 1910 Ituna Bon Accord No. 246 3546−23.9%1.2528.0/km2
Hyas May 23, 1919 Clayton No. 333 70114−38.6%1.1759.8/km2
Invermay September 1, 1908 Invermay No. 305 273247+10.5%1.22223.8/km2
Jansen October 19, 1908 Wolverine No. 340 96126−23.8%0.85112.9/km2
Keeler July 5, 1910 Marquis No. 191 15150.0%1.0214.7/km2
Kelliher April 27, 1909 Kellross No. 247 217216+0.5%2.8177.2/km2
Kenaston July 18, 1910 McCraney No. 282 282285−1.1%1.17241.0/km2
Kendal February 17, 1919 Montmartre No. 126 8377+7.8%0.65127.7/km2
Kennedy November 5, 1907 Wawken No. 93 216241−10.4%1.56138.5/km2
Kenosee Lake October 1, 1987 Wawken No. 93 234258−9.3%0.35668.6/km2
Killaly April 28, 1909 McLeod No. 185 6574−12.2%2.5925.1/km2
Kincaid July 19, 1913 Pinto Creek No. 75 111114−2.6%0.82135.4/km2
Kinley January 7, 1909 Perdue No. 346 6045+33.3%1.1850.8/km2
Kisbey May 8, 1907 Brock No. 64 153217−29.5%2.7755.2/km2
Krydor August 25, 1914 Redberry No. 435 15150.0%0.8218.3/km2
Laird May 4, 1911 Rosthern No. 403 267287−7.0%1.29207.0/km2
Lake Lenore April 28, 1921 Lake Lenore No. 399 284297−4.4%0.97292.8/km2
Lancer September 11, 1913 Miry Creek No. 229 6961+13.1%1.3351.9/km2
Landis May 17, 1909 Reford No. 379 152139+9.4%0.8190.0/km2
Lang July 27, 1906 Scott No. 98 189200−5.5%0.64295.3/km2
Leask September 3, 1912 Leask No. 464 399413−3.4%0.75532.0/km2
Lebret October 14, 1912 North Qu'Appelle No. 187 216199+8.5%1.31164.9/km2
Leoville June 26, 1944 Spiritwood No. 496 375366+2.5%1.11337.8/km2
Leross December 1, 1909 Kellross No. 247 4637+24.3%1.2138.0/km2
Liberty January 23, 1912 Big Arm No. 251 7888−11.4%1.3756.9/km2
Limerick July 10, 1913 Stonehenge No. 73 1151150.0%0.79145.6/km2
Lintlaw December 14, 1921 Hazel Dell No. 335 172162+6.2%1.23139.8/km2
Lipton May 15, 1905 Lipton No. 217 345372−7.3%0.75460.0/km2
Loon Lake January 1, 1950 Loon Lake No. 561 288314−8.3%0.66436.4/km2
Loreburn May 20, 1909 Loreburn No. 254 1071070.0%0.62172.6/km2
Love June 2, 1945 Torch River No. 488 5065−23.1%0.46108.7/km2
Lucky Lake November 23, 1920 Canaan No. 225 289287+0.7%0.66437.9/km2
MacNutt February 22, 1913 Churchbridge No. 211 65650.0%0.8180.2/km2
Macoun October 16, 1903 Cymri No. 36 269246+9.3%1.68160.1/km2
Macrorie February 8, 1912 Fertile Valley No. 285 6865+4.6%0.7788.3/km2
Major September 29, 1914 Prairiedale No. 321 3561−42.6%2.7812.6/km2
Makwa June 1, 1965 Loon Lake No. 561 8497−13.4%0.66127.3/km2
Mankota February 3, 1941 Mankota No. 45 205211−2.8%1.42144.4/km2
Manor April 15, 1902 Moose Mountain No. 63 295322−8.4%2.79105.7/km2
Marcelin September 25, 1911 Blaine Lake No. 434 153158−3.2%1.32115.9/km2
Marengo November 5, 1910 Milton No. 292 6747+42.6%0.8777.0/km2
Margo April 24, 1911 Sasman No. 336 83100−17.0%0.8103.8/km2
Markinch February 16, 1911 Cupar No. 218 5872−19.4%0.6885.3/km2
Marquis March 21, 1910 Marquis No. 191 9792+5.4%0.63154.0/km2
Marsden April 24, 1931 Manitou Lake No. 442 297284+4.6%0.94316.0/km2
Maryfield August 21, 1907 Maryfield No. 91 348365−4.7%2.69129.4/km2
Maymont June 24, 1907 Mayfield No. 406 138146−5.5%0.66209.1/km2
McLean September 1, 1966 South Qu'Appelle No. 157 405304+33.2%1.33304.5/km2
McTaggart October 5, 1909 Weyburn No. 67 121125−3.2%0.69175.4/km2
Meacham June 19, 1912 Colonsay No. 342 9984+17.9%1.2778.0/km2
Meath Park May 23, 1938 Garden River No. 490 175205−14.6%0.77227.3/km2
Medstead April 23, 1931 Medstead No. 497 130120+8.3%0.67194.0/km2
Mendham April 1, 1930 Happyland No. 231 3035−14.3%0.560.0/km2
Meota July 6, 1911 Meota No. 468 304307−1.0%1.55196.1/km2
Mervin March 17, 1920 Mervin No. 499 159160−0.6%0.73217.8/km2
Middle Lake January 1, 1963 Three Lakes No. 400 241242−0.4%1.26191.3/km2
Milden July 20, 1911 Milden No. 286 167181−7.7%1.19140.3/km2
Minton January 1, 1951 Surprise Valley No. 9 5560−8.3%0.3183.3/km2
Mistatim July 1, 1952 Bjorkdale No. 426 10173+38.4%0.47214.9/km2
Montmartre October 19, 1908 Montmartre No. 126 490476+2.9%1.7288.2/km2
Mortlach January 1, 1949 Wheatlands No. 163 261289−9.7%2.7694.6/km2
Muenster August 18, 1908 St. Peter No. 369 430422+1.9%1.33323.3/km2
Neilburg January 1, 1947 Hillsdale No. 440 379448−15.4%1.22310.7/km2
Netherhill April 28, 1910 Kindersley No. 290 25250.0%0.7334.2/km2
Neudorf April 25, 1905 McLeod No. 185 263272−3.3%2.05128.3/km2
Neville July 5, 1912 Whiska Creek No. 106 8783+4.8%1.179.1/km2
North Portal November 16, 1903 Coalfields No. 4 115143−19.6%2.4946.2/km2
Odessa March 14, 1911 Francis No. 127 205239−14.2%1.18173.7/km2
Osage May 8, 1906 Fillmore No. 96 20200.0%0.5933.9/km2
Paddockwood January 1, 1949 Paddockwood No. 520 154163−5.5%0.65236.9/km2
Pangman May 17, 1911 Norton No. 69 232214+8.4%0.73317.8/km2
Paradise Hill January 1, 1947 Frenchman Butte No. 501 491515−4.7%2.56191.8/km2
Parkside February 21, 1913 Leask No. 464 121125−3.2%0.92131.5/km2
Paynton May 2, 1907 Paynton No. 470 148151−2.0%0.85174.1/km2
Pelly May 4, 1911 St. Philips No. 301 285283+0.7%0.96296.9/km2
Pennant July 29, 1912 Riverside No. 168 130120+8.3%0.65200.0/km2
Perdue July 15, 1909 Perdue No. 346 334362−7.7%1.1303.6/km2
Pierceland January 1, 1973 Beaver River No. 622 598551+8.5%2.69222.3/km2
Pilger January 1, 1969 Three Lakes No. 400 65650.0%0.52125.0/km2
Pleasantdale January 1, 1987 Pleasantdale No. 398 76760.0%0.56135.7/km2
Plenty March 25, 1911 Winslow No. 319 164131+25.2%0.65252.3/km2
Plunkett December 28, 1921 Viscount No. 341 6075−20.0%0.6493.8/km2
Prelate October 25, 1913 Happyland No. 231 154124+24.2%0.87177.0/km2
Prud'homme November 15, 1922 Bayne No. 371 167172−2.9%0.84198.8/km2
Punnichy October 22, 1909 Mount Hope No. 279 213246−13.4%0.68313.2/km2
Quill Lake December 8, 1906 Lakeside No. 338 387409−5.4%1.3297.7/km2
Quinton March 1, 1910 Mount Hope No. 279 101111−9.0%0.96105.2/km2
Rama December 18, 1919 Invermay No. 305 8075+6.7%0.67119.4/km2
Rhein March 10, 1913 Wallace No. 243 170158+7.6%1.09156.0/km2
Richard October 11, 1916 Douglas No. 436 2030−33.3%0.7327.4/km2
Richmound May 5, 1947 Enterprise No. 142 147154−4.5%0.47312.8/km2
Ridgedale December 15, 1921 Connaught No. 457 5580−31.2%0.7276.4/km2
Riverhurst June 22, 1916 Maple Bush No. 224 130114+14.0%0.91142.9/km2
Roche Percee January 12, 1909 Coalfields No. 4 110153−28.1%2.8338.9/km2
Ruddell March 18, 1914 Mayfield No. 406 20200.0%0.4742.6/km2
Rush Lake October 16, 1911 Excelsior No. 166 5365−18.5%0.7471.6/km2
Sceptre April 30, 1913 Clinworth No. 230 9497−3.1%1.2376.4/km2
Sedley August 3, 1907 Francis No. 127 358337+6.2%1.33269.2/km2
Semans December 14, 1908 Mount Hope No. 279 196204−3.9%1.14171.9/km2
Senlac October 11, 1916 Senlac No. 411 4146−10.9%0.668.3/km2
Shamrock January 1, 1960 Shamrock No. 134 20200.0%0.7925.3/km2
Sheho June 30, 1905 Insinger No. 244 105130−19.2%1.9553.8/km2
Shell Lake October 18, 1940 Spiritwood No. 496 175152+15.1%1.23142.3/km2
Silton July 2, 1914 McKillop No. 220 7195−25.3%1.0766.4/km2
Simpson July 11, 1911 Wood Creek No. 281 127131−3.1%1.4190.1/km2
Smeaton March 7, 1944 Torch River No. 488 182181+0.6%1.48123.0/km2
Smiley November 26, 1913 Prairiedale No. 321 60600.0%0.6493.8/km2
Spalding March 11, 1924 Spalding No. 368 244242+0.8%1.18206.8/km2
Speers December 24, 1915 Douglas No. 436 6065−7.7%0.6987.0/km2
Spy Hill April 22, 1910 Spy Hill No. 152 168204−17.6%1.19141.2/km2
St. Benedict January 1, 1964 Three Lakes No. 400 8482+2.4%0.54155.6/km2
St. Gregor March 26, 1920 St. Peter No. 369 9798−1.0%0.91106.6/km2
St. Louis May 19, 1959 St. Louis No. 431 415449−7.6%1.08384.3/km2
Stenen August 14, 1912 Clayton No. 333 9079+13.9%0.7128.6/km2
Stewart Valley January 1, 1958 Saskatchewan Landing No. 167 9176+19.7%0.86105.8/km2
Stockholm June 30, 1905 Fertile Belt No. 183 352341+3.2%1.65213.3/km2
Storthoaks June 5, 1940 Storthoaks No. 31 10893+16.1%0.49220.4/km2
Strongfield May 3, 1912 Loreburn No. 254 40400.0%0.850.0/km2
Success October 25, 1912 Riverside No. 168 4540+12.5%1.3832.6/km2
Tantallon June 17, 1904 Spy Hill No. 152 91105−13.3%0.84108.3/km2
Tessier August 24, 1909 Harris No. 316 25250.0%125.0/km2
Theodore July 5, 1907 Insinger No. 275 323345−6.4%1.73186.7/km2
Togo September 4, 1906 Cote No. 271 8687−1.1%1.557.3/km2
Tompkins June 2, 1910 Gull Lake No. 139 152170−10.6%2.6557.4/km2
Torquay December 11, 1923 Cambria No. 6 255236+8.1%1.35188.9/km2
Tramping Lake April 10, 1917 Tramping Lake No. 380 6055+9.1%1.3943.2/km2
Tugaske May 7, 1909 Huron No. 223 7592−18.5%0.7698.7/km2
Tuxford July 19, 1907 Marquis No. 191 11391+24.2%0.62182.3/km2
Val Marie September 13, 1926 Val Marie No. 17 126130−3.1%0.42300.0/km2
Valparaiso July 18, 1924 Star City No. 428 15150.0%0.6921.7/km2
Vanguard July 8, 1912 Whiska Creek No. 106 134152−11.8%1.8672.0/km2
Vanscoy June 17, 1919 Vanscoy No. 345 462377+22.5%1.49310.1/km2
Vibank June 23, 1911 Francis No. 127 385374+2.9%0.73527.4/km2
Viscount December 17, 1908 Viscount No. 341 232252−7.9%1.18196.6/km2
Waldeck December 23, 1913 Excelsior No. 166 277297−6.7%2138.5/km2
Waldron July 17, 1909 Grayson No. 184 1520−25.0%1.4510.3/km2
Waseca March 15, 1911 Eldon No. 471 149154−3.2%0.68219.1/km2
Webb June 18, 1910 Webb No. 138 5058−13.8%1.4135.5/km2
Weekes January 13, 1947 Porcupine No. 395 4042−4.8%0.5967.8/km2
Weirdale April 1, 1948 Garden River No. 490 5075−33.3%1.3636.8/km2
Weldon January 24, 1914 Kinistino No. 459 197196+0.5%1.1179.1/km2
White Fox July 21, 1941 Torch River No. 488 355364−2.5%0.85417.6/km2
Wilcox April 20, 1907 Bratt's Lake No. 129 264339−22.1%1.48178.4/km2
Windthorst August 21, 1907 Chester No. 125 211215−1.9%1.43147.6/km2
Wiseton September 23, 1913 Milden No. 286 7988−10.2%0.77102.6/km2
Wood Mountain March 4, 1930 Old Post No. 43 2025−20.0%0.6132.8/km2
Yarbo July 1, 1964 Langenburg No. 181 5753+7.5%0.8368.7/km2
Young June 7, 1910 Morris No. 312 244239+2.1%2.5197.2/km2
Zelma August 10, 1910 Morris No. 312 35350.0%0.7248.6/km2
Zenon Park July 28, 1941 Arborfield No. 456 194187+3.7%0.56346.4/km2
Total villages41,51441,945−1.0%295.11140.67/km2

Yukon

Yukon had four villages as of January 1, 2012. [5]

NamePopulation
(2011) [34]
Population
(2006) [34]
Change
(%) [34]
Area
(km2) [34]
Population
density [34]
Carmacks 50342518.436.9513.6
Haines Junction 5935890.734.4917.2
Mayo 226248−8.91.06213.2
Teslin 122141−13.51.9263.6
Total villages1,4441,4032.974.4219.4

See also

Related Research Articles

<span class="mw-page-title-main">Leduc, Alberta</span> City in Alberta, Canada

Leduc is a city in the province of Alberta, Canada. It is 33 km (21 mi) south of the provincial capital of Edmonton and is part of the Edmonton Metropolitan Region.

<span class="mw-page-title-main">Lloydminster</span> City in Alberta and Saskatchewan, Canada

Lloydminster is a city in Canada which has the unusual geographic distinction of straddling the provincial border between Alberta and Saskatchewan. The city is incorporated by both provinces as a single city with a single municipal administration.
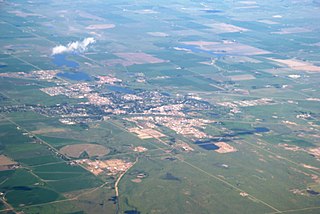
<span class="mw-page-title-main">Stony Plain, Alberta</span> Town in Alberta, Canada

Stony Plain is a town in the Edmonton Metropolitan Region of Alberta, Canada that is surrounded by Parkland County. It is west of Edmonton adjacent to the City of Spruce Grove and sits on Treaty 6 land.

<span class="mw-page-title-main">Strathmore, Alberta</span> Town in Alberta, Canada

Strathmore is a town located in southern Alberta, Canada that is surrounded by Wheatland County. It is along the Trans-Canada Highway approximately 50 kilometres (30 mi) east of Calgary.

<span class="mw-page-title-main">Municipal District of Bonnyville No. 87</span> Municipal district in Alberta, Canada

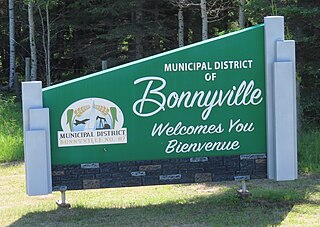
The Municipal District of Bonnyville No. 87 is a municipal district (MD) in northeastern Alberta, Canada in Division No. 12. On the east, it is adjacent to the province of Saskatchewan.

<span class="mw-page-title-main">Beaumont, Alberta</span> City in Alberta, Canada

Beaumont is a city in Leduc County within the Edmonton Metropolitan Region of Alberta, Canada. It is located at the intersection of Highway 625 and Highway 814, adjacent to the City of Edmonton and 6.0 kilometres (3.7 mi) northeast of the City of Leduc. The Nisku Industrial Park and the Edmonton International Airport are located 4.0 kilometres (2.5 mi) to the west and 8.0 kilometres (5.0 mi) to the southwest respectively.

<span class="mw-page-title-main">High River</span> Town in Alberta, Canada

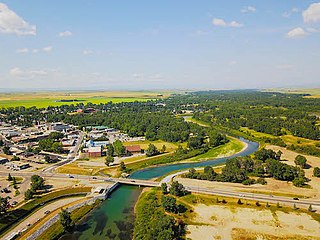
High River is a town within the Calgary Metropolitan Region of Alberta, Canada. It is approximately 68 kilometres (42 mi) south of Calgary, at the junction of Alberta Highways 2 and 23. High River had a population of 14,324 in 2021.

<span class="mw-page-title-main">Chauvin, Alberta</span> Village in Alberta, Canada

Chauvin is a village in east central Alberta, Canada. It is located 60 kilometres (37 mi) east of Wainwright, and 10 kilometres (6.2 mi) west of the Saskatchewan border. It is also the home of Susie the Softball, the world's largest softball.

<span class="mw-page-title-main">Ryley</span> Village in Alberta, Canada

Ryley is a village in central Alberta, Canada. It is surrounded by Beaver County, along Highway 14 between the City of Edmonton and the Town of Viking. The City of Camrose is approximately 58 km (36 mi) south of Ryley. The village was named in 1908 after George Urquhart Ryley, Grand Trunk Pacific Railway Land Commissioner at the time.

<span class="mw-page-title-main">Beaver County, Alberta</span> Municipal district in Alberta, Canada

Beaver County is a municipal district in central-east Alberta, Canada. It is centred on Holden in the western part of Census Division No. 10. Its municipal office is located in Ryley.

<span class="mw-page-title-main">Mackenzie County</span> Specialized municipality in Alberta, Canada

Mackenzie County is a specialized municipality in northern Alberta, Canada. It is located in Census Division 17, along the Mackenzie Highway. The municipal office is located in the hamlet of Fort Vermilion.

<span class="mw-page-title-main">Rural Municipality of Milton No. 292</span> Rural municipality in Saskatchewan, Canada

The Rural Municipality of Milton No. 292 is a rural municipality (RM) in the Canadian province of Saskatchewan within Census Division No. 13 and SARM Division No. 6. Located in the west-central portion of the province, it is adjacent to the Alberta boundary.

<span class="mw-page-title-main">Rural Municipality of Argyle No. 1</span> Rural municipality in Saskatchewan, Canada

The Rural Municipality of Argyle No. 1 is a rural municipality (RM) in the Canadian province of Saskatchewan within Census Division No. 1 and SARM Division No. 1. It is located in the southeast corner of the province along Highway 18.

<span class="mw-page-title-main">Bellis, Alberta</span> Hamlet in Alberta, Canada

Bellis is a hamlet in central Alberta, Canada within Smoky Lake County. Previously an incorporated municipality, Bellis dissolved from village status on January 1, 1946 to become part of the Municipal District of Vilna No. 575.

<span class="mw-page-title-main">Rural Municipality of Scott No. 98</span> Rural municipality in Saskatchewan, Canada

The Rural Municipality of Scott No. 98 is a rural municipality (RM) in the Canadian province of Saskatchewan within Census Division No. 2 and SARM Division No. 2. It is located in the southeast portion of the province.

Canada has a total of 3,573 municipalities among its 10 provinces and 3 territories that are subject to some form of local government.

References

  1. 1 2 3 4 "Population and dwelling counts, for Canada, provinces and territories, and census subdivisions (municipalities), 2011 and 2006 censuses (Ontario)". Statistics Canada. May 28, 2012. Retrieved January 3, 2013.
  2. 1 2 "New Brunswick Regulation 2012-18". New Brunswick Attorney General. March 15, 2012. Retrieved January 5, 2013.
  3. "Order in Council (O.C.) 328/2012". Province of Alberta. October 17, 2012. Retrieved January 5, 2013.
  4. 1 2 3 "Urban Municipality Incorporations". Saskatchewan Ministry of Government Relations. Archived from the original on February 25, 2012. Retrieved January 5, 2013.
  5. 1 2 3 4 5 6 7 8 9 10 11 12 "Interim List of Changes to Municipal Boundaries, Status, and Names" (PDF). Statistics Canada. 2012. p. 6. Retrieved January 4, 2013.
  6. "2022 Municipal Codes" (PDF). Alberta Municipal Affairs. January 5, 2022. Retrieved January 21, 2022.
  7. "Communities Within Specialized and Rural Municipalities" (PDF). Alberta Municipal Affairs. April 9, 2013. Retrieved May 21, 2013.
  8. "Municipal Profiles: Summary Reports (Towns)" (PDF). Alberta Municipal Affairs. May 17, 2013. Retrieved May 21, 2013.
  9. 1 2 3 4 5 "Population and dwelling counts, for Canada, provinces and territories, and census subdivisions (municipalities), 2016 and 2011 censuses – 100% data (Alberta)". Statistics Canada. February 7, 2018. Retrieved February 7, 2021.
  10. "Order in Council 979/11" (PDF). Alberta Municipal Affairs. December 16, 1911. Retrieved July 26, 2010.
  11. "Change in Name of Village Municipality Highland to Delia" (PDF). Alberta Municipal Affairs. December 9, 1915. Retrieved July 26, 2010.
  12. "Municipal Profiles (Villages)" (PDF). Alberta Municipal Affairs. February 5, 2021. Retrieved February 7, 2021.
  13. "The Village of Ryley Equity". Village of Ryley. Archived from the original on February 22, 2012. Retrieved April 13, 2010.
  14. "Order in Council 517/98". Alberta Municipal Affairs. December 9, 1998. Retrieved July 26, 2010.
  15. 1 2 3 4 "British Columbia Regional Districts, Municipalities, Corporate Name, Date of Incorporation and Postal Address" (XLS). British Columbia Ministry of Communities, Sport and Cultural Development. Archived from the original on July 13, 2014. Retrieved December 8, 2012.
  16. 1 2 3 4 5 "Population and dwelling counts, for Canada, provinces and territories, and census subdivisions (municipalities), 2011 and 2006 censuses (British Columbia)". Statistics Canada. May 28, 2012. Retrieved December 8, 2012.
  17. Ministry of Municipal Affairs (July 13, 2022). "Ancestral Haida name restored to Haida Gwaii village". BC Gov News. Government of British Columbia. Retrieved July 23, 2022.
  18. "Name Details: Granisle". GeoBC. Retrieved July 5, 2013.
  19. "Corrections and updates: Population and dwelling count amendments, 2011 Census". Statistics Canada. March 21, 2013. Retrieved January 1, 2015.
  20. 1 2 3 4 5 "Population and dwelling counts, for Canada, provinces and territories, and census subdivisions (municipalities), 2016 and 2011 censuses – 100% data (Manitoba)". Statistics Canada. February 8, 2017. Retrieved May 17, 2020.
  21. "Foxwarren (Unincorporated Village)". Manitoba Historical Society. Retrieved May 19, 2020.
  22. "Garson / Lyall (Unincorporated Village)". Manitoba Historical Society. Retrieved May 19, 2020.
  23. "Great Falls (Unincorporated Village)". Manitoba Historical Society. Retrieved May 19, 2020.
  24. "Powerview (Village)". Manitoba Historical Society. Retrieved May 19, 2020.
  25. 1 2 "Population and dwelling counts: Canada, provinces and territories, census divisions and census subdivisions (municipalities), New Brunswick". Statistics Canada. February 9, 2022. Retrieved February 21, 2022.
  26. 1 2 "Place Names of New Brunswick: Where is Home? New Brunswick Communities Past and Present". Government of New Brunswick. 2023. Retrieved 7 May 2023.
  27. "Population and dwelling count amendments, 2021 Census". Statistics Canada. July 13, 2022. Retrieved July 16, 2022.
  28. 1 2 3 4 5 "Population and dwelling counts, for Canada, provinces and territories, and census subdivisions (municipalities), 2011 and 2006 censuses (Northwest Territories)". Statistics Canada. May 28, 2012. Retrieved January 4, 2013.
  29. 1 2 3 4 "Population and dwelling counts, for Canada, provinces and territories, and census subdivisions (municipalities), 2016 and 2011 censuses (Ontario)". Statistics Canada.
  30. 1 2 "List of Ontario Municipalities". Ontario Municipal Affairs and Housing. September 21, 2012. Archived from the original on February 28, 2013. Retrieved January 3, 2013.
  31. "Urban Municipality Incorporations". Saskatchewan Ministry of Government Relations. Archived from the original on October 15, 2014. Retrieved June 7, 2020.
  32. "Search for Municipal Information". Saskatchewan Ministry of Municipal Affairs. Archived from the original on March 10, 2014. Retrieved December 16, 2012.
  33. 1 2 3 4 5 "Population and dwelling counts, for Canada, provinces and territories, and census subdivisions (municipalities), 2016 and 2011 censuses – 100% data (Saskatchewan)". Statistics Canada. February 8, 2017. Retrieved June 7, 2020.
  34. 1 2 3 4 5 "Population and dwelling counts, for Canada, provinces and territories, and census subdivisions (municipalities), 2011 and 2006 censuses (Yukon)". Statistics Canada. May 28, 2012. Retrieved January 4, 2013.