The 64 counties of the State of Colorado |
This is a population history of the 210 census-designated places in the US state of Colorado since the 2000 United States census. [1] The United States Census Bureau defines certain unincorporated communities as census-designated places (CDPs) for enumeration in each decennial census. The Census Bureau defined 85 CDPs in Colorado for the 2000 Census, 187 CDPs for the 2010 Census, and 210 CDPs for the 2020 Census. [1]
At the 2020 United States census, the Highlands Ranch CDP was the most populous CDP in Colorado with 103,444 residents. The Fulford CDP lost both of its residents before the 2020 Census.
† | County seat |
---|
Census-designated place [1] | Population [2] | |||||
---|---|---|---|---|---|---|
2020 Rank | 2020 Census | Change | 2010 Census | Change | 2000 Census | |
Acres Green CDP | 50 | 2,922 | −2.83% | 3,007 | −6.18% | 3,205 |
Aetna Estates CDP | 62 | 1,496 | +79.38% | 834 | NA | NA |
Air Force Academy CDP | 31 | 6,608 | −1.08% | 6,680 | −11.24% | 7,526 |
Alamosa East CDP | 64 | 1,453 | −0.34% | 1,458 | −4.58% | 1,528 |
Allenspark CDP | 88 | 568 | +7.58% | 528 | +6.45% | 496 |
Alpine CDP | 140 | 169 | −2.87% | 174 | NA | NA |
Altona CDP | 92 | 512 | +2.20% | 501 | NA | NA |
Amherst CDP | 190 | 47 | −18.97% | 58 | NA | NA |
Applewood CDP | 28 | 7,833 | +9.40% | 7,160 | +0.52% | 7,123 |
Arapahoe CDP | 165 | 102 | NA | NA | NA | NA |
Arboles CDP | 109 | 308 | +10.00% | 280 | +20.69% | 232 |
Aristocrat Ranchettes CDP | 60 | 1,715 | +27.60% | 1,344 | +7.18% | 1,254 |
Aspen Park CDP | 78 | 810 | −8.16% | 882 | +0.92% | 874 |
Atwood CDP | 147 | 138 | +3.76% | 133 | −31.79% | 195 |
Avondale CDP | 87 | 594 | −11.87% | 674 | −10.61% | 754 |
Bark Ranch CDP | 128 | 202 | −5.16% | 213 | NA | NA |
Battlement Mesa CDP | 34 | 5,438 | +21.63% | 4,471 | +27.85% | 3,497 |
Berkley CDP | 14 | 12,536 | +11.86% | 11,207 | +4.32% | 10,743 |
Beulah Valley CDP | 91 | 518 | −6.83% | 556 | −52.23% | 1,164 |
Black Forest CDP | 13 | 15,097 | +15.10% | 13,116 | −0.99% | 13,247 |
Blende CDP | 79 | 788 | −10.25% | 878 | NA | NA |
Blue Sky CDP | 181 | 65 | +170.83% | 24 | NA | NA |
Blue Valley CDP | 137 | 173 | NA | NA | NA | NA |
Bonanza Mountain Estates CDP | 156 | 127 | −0.78% | 128 | NA | NA |
Brandon CDP | 204 | 21 | 0.00% | 21 | NA | NA |
Brick Center CDP | 164 | 105 | −1.87% | 107 | NA | NA |
Briggsdale CDP | 150 | 134 | NA | NA | NA | NA |
Brook Forest CDP | 85 | 622 | NA | NA | NA | NA |
Byers CDP | 66 | 1,322 | +13.97% | 1,160 | −5.92% | 1,233 |
Capulin CDP | 150 | 134 | −33.00% | 200 | NA | NA |
Cascade-Chipita Park CDP | 61 | 1,628 | −1.63% | 1,655 | −3.16% | 1,709 |
Castle Pines Village CDP | 38 | 4,327 | +19.73% | 3,614 | −39.34% | 5,958 |
Cathedral CDP | 207 | 15 | +7.14% | 14 | NA | NA |
Catherine CDP | 122 | 235 | +3.07% | 228 | NA | NA |
Cattle Creek CDP | 83 | 662 | +3.28% | 641 | NA | NA |
Chacra CDP | 106 | 331 | +0.61% | 329 | NA | NA |
Cherry Creek CDP | 15 | 11,488 | +3.31% | 11,120 | NA | NA |
Cimarron Hills CDP | 9 | 19,311 | +19.49% | 16,161 | +6.36% | 15,194 |
Clifton CDP | 8 | 20,413 | +2.63% | 19,889 | +14.67% | 17,345 |
Coal Creek CDP [lower-alpha 1] | 53 | 2,494 | +3.92% | 2,400 | +3.31% | 2,323 |
Coaldale CDP | 103 | 343 | +34.51% | 255 | NA | NA |
Colona CDP | 199 | 36 | +20.00% | 30 | NA | NA |
Colorado City CDP | 55 | 2,237 | +2.01% | 2,193 | +8.67% | 2,018 |
Columbine CDP | 6 | 25,229 | +3.91% | 24,280 | +0.77% | 24,095 |
Comanche Creek CDP | 96 | 442 | +19.78% | 369 | NA | NA |
Conejos CDP [lower-alpha 2] † | 191 | 46 | −20.69% | 58 | NA | NA |
Cope CDP | 188 | 53 | NA | NA | NA | NA |
Copper Mountain CDP | 84 | 650 | +68.83% | 385 | NA | NA |
Cotopaxi CDP | 194 | 44 | −6.38% | 47 | NA | NA |
Crisman CDP | 135 | 179 | −3.76% | 186 | NA | NA |
Dakota Ridge CDP | 3 | 33,892 | +5.90% | 32,005 | NA | NA |
Derby CDP | 25 | 8,407 | +9.39% | 7,685 | +19.65% | 6,423 |
Divide CDP | 145 | 143 | +12.60% | 127 | NA | NA |
Dotsero CDP | 70 | 1,172 | +66.24% | 705 | NA | NA |
Dove Valley CDP | 33 | 5,640 | +7.57% | 5,243 | NA | NA |
Downieville-Lawson-Dumont CDP | 90 | 527 | −11.28% | 594 | +63.19% | 364 |
East Pleasant View CDP | 104 | 333 | −6.46% | 356 | −3.52% | 369 |
Echo Hills CDP | 108 | 313 | NA | NA | NA | NA |
Edwards CDP | 17 | 11,246 | +9.55% | 10,266 | +24.33% | 8,257 |
El Jebel CDP | 41 | 4,130 | +8.66% | 3,801 | −15.31% | 4,488 |
El Moro CDP | 125 | 216 | −2.26% | 221 | NA | NA |
Elbert CDP | 131 | 188 | −18.26% | 230 | NA | NA |
Eldora CDP | 146 | 140 | −1.41% | 142 | −16.47% | 170 |
Eldorado Springs CDP | 89 | 559 | −4.44% | 585 | +5.03% | 557 |
Ellicott CDP | 69 | 1,248 | +10.34% | 1,131 | NA | NA |
Evergreen CDP | 22 | 9,307 | +2.98% | 9,038 | −1.93% | 9,216 |
Fairmount CDP | 21 | 9,324 | +23.35% | 7,559 | NA | NA |
Florissant CDP | 155 | 128 | +23.08% | 104 | NA | NA |
Floyd Hill CDP | 72 | 1,048 | +5.01% | 998 | NA | NA |
Fort Carson CDP | 11 | 17,693 | +28.09% | 13,813 | +30.73% | 10,566 |
Fort Garland CDP | 95 | 464 | +7.16% | 433 | +0.23% | 432 |
Four Square Mile CDP | 7 | 22,872 | NA | NA | NA | NA |
Franktown CDP | 98 | 409 | +3.54% | 395 | +298.99% | 99 |
Fruitvale CDP | 26 | 8,271 | +7.77% | 7,675 | +10.65% | 6,936 |
Fulford CDP | 210 | 0 | −100.00% | 2 | NA | NA |
Gardner CDP | 163 | 106 | NA | NA | NA | NA |
Garfield CDP | 202 | 27 | +80.00% | 15 | NA | NA |
Genesee CDP | 44 | 3,610 | +0.03% | 3,609 | −2.43% | 3,699 |
Gerrard CDP | 117 | 264 | −5.04% | 278 | NA | NA |
Glendale CDP [lower-alpha 3] | 182 | 64 | −7.25% | 69 | NA | NA |
Gleneagle CDP | 30 | 6,649 | +0.57% | 6,611 | +55.70% | 4,246 |
Gold Hill CDP | 124 | 218 | −5.22% | 230 | +9.52% | 210 |
Goldfield CDP | 184 | 63 | +28.57% | 49 | NA | NA |
Grand View Estates CDP | 81 | 689 | +30.49% | 528 | −23.59% | 691 |
Guffey CDP | 162 | 111 | +13.27% | 98 | NA | NA |
Gunbarrel CDP | 18 | 9,554 | +3.14% | 9,263 | −1.82% | 9,435 |
Hartsel CDP | 197 | 38 | NA | NA | NA | NA |
Hasty CDP | 133 | 182 | +26.39% | 144 | NA | NA |
Heeney CDP | 176 | 74 | −2.63% | 76 | NA | NA |
Hidden Lake CDP | 203 | 24 | −22.58% | 31 | NA | NA |
Highlands Ranch CDP | 1 | 103,444 | +6.96% | 96,713 | +36.35% | 70,931 |
Hoehne CDP | 171 | 80 | −27.93% | 111 | NA | NA |
Holly Hills CDP [lower-alpha 4] | 52 | 2,683 | +6.43% | 2,521 | NA | NA |
Howard CDP | 77 | 852 | +17.84% | 723 | NA | NA |
Idalia CDP | 168 | 97 | +10.23% | 88 | NA | NA |
Idledale CDP | 120 | 244 | −3.17% | 252 | NA | NA |
Indian Hills CDP | 63 | 1,474 | +15.16% | 1,280 | +6.93% | 1,197 |
Inverness CDP | 56 | 2,226 | +45.30% | 1,532 | NA | NA |
Jackson Lake CDP | 152 | 131 | −14.94% | 154 | NA | NA |
Jansen CDP | 166 | 101 | −9.82% | 112 | NA | NA |
Joes CDP | 170 | 82 | +2.50% | 80 | NA | NA |
Johnson Village CDP | 110 | 299 | +21.54% | 246 | NA | NA |
Ken Caryl CDP | 4 | 33,811 | +4.23% | 32,438 | +5.02% | 30,887 |
Keystone CDP | 65 | 1,369 | +26.88% | 1,079 | +30.79% | 825 |
Kirk CDP | 185 | 61 | +3.39% | 59 | NA | NA |
Kittredge CDP | 68 | 1,308 | +0.31% | 1,304 | +36.69% | 954 |
La Junta Gardens CDP | 158 | 123 | −19.61% | 153 | NA | NA |
Laird CDP | 191 | 46 | −2.13% | 47 | NA | NA |
Laporte CDP [lower-alpha 5] | 54 | 2,409 | −1.67% | 2,450 | −8.96% | 2,691 |
Lazear CDP | 141 | 168 | NA | NA | NA | NA |
Lazy Acres CDP | 76 | 957 | +4.02% | 920 | NA | NA |
Leadville North CDP | 58 | 1,892 | +5.46% | 1,794 | −7.62% | 1,942 |
Lewis CDP | 119 | 257 | −14.90% | 302 | NA | NA |
Leyner CDP | 196 | 40 | +37.93% | 29 | NA | NA |
Lincoln Park CDP | 42 | 3,934 | +10.94% | 3,546 | −9.17% | 3,904 |
Loghill Village CDP | 86 | 617 | +18.43% | 521 | +67.52% | 311 |
Loma CDP | 67 | 1,314 | +1.62% | 1,293 | NA | NA |
Louviers CDP | 112 | 293 | +8.92% | 269 | +13.50% | 237 |
Lynn CDP | 208 | 11 | −8.33% | 12 | NA | NA |
Marvel CDP | 177 | 68 | NA | NA | NA | NA |
Matheson CDP | 172 | 79 | NA | NA | NA | NA |
Maybell CDP | 173 | 76 | +5.56% | 72 | NA | NA |
Maysville CDP | 137 | 173 | +28.15% | 135 | NA | NA |
McClave CDP | 153 | 129 | NA | NA | NA | NA |
McCoy CDP | 201 | 30 | +25.00% | 24 | NA | NA |
Meridian CDP | 37 | 4,786 | +61.14% | 2,970 | +1,514.13% | 184 |
Meridian Village CDP | 48 | 3,202 | NA | NA | NA | NA |
Midland CDP | 133 | 182 | +16.67% | 156 | NA | NA |
Morgan Heights CDP | 111 | 298 | +12.03% | 266 | NA | NA |
Mountain Meadows CDP | 121 | 237 | −13.50% | 274 | NA | NA |
Mulford CDP | 118 | 259 | +48.85% | 174 | NA | NA |
Nathrop CDP | 114 | 288 | NA | NA | NA | NA |
Niwot CDP | 40 | 4,306 | +7.49% | 4,006 | −3.70% | 4,160 |
No Name CDP | 160 | 117 | −4.88% | 123 | NA | NA |
Norrie CDP | 209 | 7 | 0.00% | 7 | NA | NA |
North La Junta CDP | 94 | 482 | −5.86% | 512 | NA | NA |
North Washington CDP | 80 | 733 | +51.45% | 484 | −11.84% | 549 |
Orchard CDP | 173 | 76 | −15.56% | 90 | NA | NA |
Orchard Mesa CDP | 29 | 6,688 | −2.17% | 6,836 | +5.89% | 6,456 |
Padroni CDP | 175 | 75 | −1.32% | 76 | −21.65% | 97 |
Paragon Estates CDP | 74 | 975 | +5.06% | 928 | NA | NA |
Park Center CDP | 49 | 2,953 | NA | NA | NA | NA |
Parshall CDP | 195 | 42 | −10.64% | 47 | NA | NA |
Penrose CDP | 43 | 3,685 | +2.88% | 3,582 | −11.99% | 4,070 |
Peoria CDP | 144 | 153 | −6.13% | 163 | NA | NA |
Perry Park CDP | 57 | 1,932 | +17.38% | 1,646 | +39.49% | 1,180 |
Peyton CDP | 126 | 214 | −14.40% | 250 | NA | NA |
Phippsburg CDP | 123 | 234 | +14.71% | 204 | NA | NA |
Piedra CDP | 200 | 31 | +10.71% | 28 | NA | NA |
Pine Brook Hill CDP | 74 | 975 | −0.81% | 983 | NA | NA |
Pine Valley CDP | 101 | 363 | NA | NA | NA | NA |
Placerville CDP | 102 | 362 | NA | NA | NA | NA |
Ponderosa Park CDP | 46 | 3,334 | +3.16% | 3,232 | +3.86% | 3,112 |
Portland CDP | 148 | 136 | +0.74% | 135 | NA | NA |
Pueblo West CDP | 5 | 33,086 | +11.64% | 29,637 | +75.38% | 16,899 |
Red Feather Lakes CDP | 97 | 426 | +24.20% | 343 | −34.67% | 525 |
Redlands CDP | 24 | 9,061 | +4.33% | 8,685 | +7.98% | 8,043 |
Redstone CDP | 156 | 127 | −2.31% | 130 | NA | NA |
Redvale CDP | 139 | 172 | −27.12% | 236 | NA | NA |
Rock Creek Park CDP | 177 | 68 | +17.24% | 58 | NA | NA |
Rollinsville CDP | 130 | 194 | +7.18% | 181 | NA | NA |
Roxborough Park CDP | 20 | 9,416 | +3.48% | 9,099 | +104.66% | 4,446 |
Saddle Ridge CDP | 179 | 66 | +17.86% | 56 | NA | NA |
Salt Creek CDP | 93 | 507 | −13.63% | 587 | −9.41% | 648 |
San Acacio CDP | 186 | 56 | +40.00% | 40 | NA | NA |
Security-Widefield CDP | 2 | 38,639 | +17.51% | 32,882 | +10.18% | 29,845 |
Sedalia CDP | 136 | 177 | −14.08% | 206 | −2.37% | 211 |
Segundo CDP | 167 | 100 | +2.04% | 98 | NA | NA |
Seven Hills CDP | 153 | 129 | +6.61% | 121 | NA | NA |
Shaw Heights CDP | 35 | 5,185 | +1.35% | 5,116 | NA | NA |
Sherrelwood CDP | 10 | 19,228 | +5.15% | 18,287 | +3.57% | 17,657 |
Sierra Ridge CDP | 45 | 3,490 | NA | NA | NA | NA |
Smeltertown CDP | 169 | 88 | −26.67% | 120 | NA | NA |
Snyder CDP | 148 | 136 | +3.03% | 132 | NA | NA |
Somerset CDP | 187 | 55 | NA | NA | NA | NA |
Southern Ute CDP | 142 | 158 | −10.73% | 177 | NA | NA |
St. Ann Highlands CDP | 107 | 325 | +12.85% | 288 | NA | NA |
St. Mary's CDP | 104 | 333 | +17.67% | 283 | +12.75% | 251 |
Stepping Stone CDP | 51 | 2,780 | NA | NA | NA | NA |
Sterling Ranch CDP | 59 | 1,789 | NA | NA | NA | NA |
Stonegate CDP | 23 | 9,072 | +1.23% | 8,962 | +42.62% | 6,284 |
Stonewall Gap CDP | 179 | 66 | −1.49% | 67 | NA | NA |
Strasburg CDP | 47 | 3,307 | +35.15% | 2,447 | +74.54% | 1,402 |
Stratmoor CDP | 32 | 6,518 | −5.54% | 6,900 | +3.76% | 6,650 |
Sugarloaf CDP | 115 | 274 | +4.98% | 261 | NA | NA |
Sunshine CDP | 129 | 198 | −13.91% | 230 | NA | NA |
Tabernash CDP | 99 | 401 | −3.84% | 417 | +152.73% | 165 |
Tall Timber CDP | 132 | 185 | −11.06% | 208 | NA | NA |
The Pinery CDP | 16 | 11,311 | +7.55% | 10,517 | +45.00% | 7,253 |
Todd Creek CDP | 36 | 5,028 | +33.44% | 3,768 | +190.07% | 1,299 |
Towaoc CDP [lower-alpha 6] | 71 | 1,120 | +3.04% | 1,087 | −0.91% | 1,097 |
Towner CDP | 206 | 18 | −18.18% | 22 | NA | NA |
Trail Side CDP | 143 | 157 | +166.10% | 59 | NA | NA |
Twin Lakes CDP [lower-alpha 7] | 27 | 8,226 | +34.83% | 6,101 | −3.17% | 6,301 |
Twin Lakes CDP [lower-alpha 7] | 127 | 204 | +19.30% | 171 | NA | NA |
Upper Bear Creek CDP | 73 | 984 | −7.08% | 1,059 | NA | NA |
Upper Witter Gulch CDP | 100 | 380 | NA | NA | NA | NA |
Valdez CDP | 191 | 46 | −2.13% | 47 | NA | NA |
Valmont CDP | 182 | 64 | +8.47% | 59 | NA | NA |
Vernon CDP | 197 | 38 | +31.03% | 29 | NA | NA |
Vineland CDP | 116 | 269 | +7.17% | 251 | NA | NA |
Watkins CDP | 82 | 682 | +4.44% | 653 | NA | NA |
Welby CDP | 12 | 15,553 | +4.76% | 14,846 | +14.44% | 12,973 |
Weldona CDP | 161 | 113 | −18.71% | 139 | NA | NA |
West Pleasant View CDP | 38 | 4,327 | +12.68% | 3,840 | −2.34% | 3,932 |
Westcreek CDP | 159 | 120 | −6.98% | 129 | +22.86% | 105 |
Weston CDP | 188 | 53 | −3.64% | 55 | NA | NA |
Wolcott CDP | 205 | 20 | +33.33% | 15 | NA | NA |
Woodmoor CDP | 19 | 9,536 | +9.10% | 8,741 | +21.79% | 7,177 |
Woody Creek CDP | 113 | 290 | +10.27% | 263 | NA | NA |
All 210 census-designated places | 714,417 | NA | 619,293 | NA | 454,721 |
There are more than 1,500 properties and historic districts in the U.S. State of Colorado listed on the National Register of Historic Places. They are distributed over 63 of Colorado's 64 counties; only the City and County of Broomfield currently has none.
The North Central Colorado Urban Area comprises the four contiguous metropolitan statistical areas in the north central region of the State of Colorado: the Denver–Aurora Metropolitan Statistical Area, the Boulder Metropolitan Statistical Area, the Fort Collins-Loveland Metropolitan Statistical Area, and the Greeley Metropolitan Statistical Area. With the exception of southeastern Elbert County, southeastern Park County, and tiny portions of southern Douglas County, the entire North Central Colorado Urban Area is drained by the South Platte River and its tributaries. The North Central Colorado Urban Area is the central, and the most populous, of the three primary subregions of the Front Range Urban Corridor.
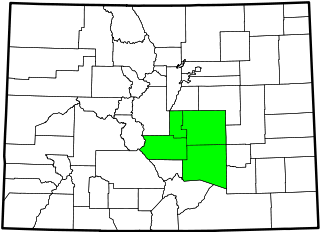
The South Central Colorado Urban Area comprises the Colorado Springs Metropolitan Statistical Area, the Pueblo Metropolitan Statistical Area, and the Cañon City Micropolitan Statistical Area in the central and south central region of the State of Colorado. With the exception of northern Teller County and small portions of northern El Paso County, the entire South Central Colorado Urban Area is drained by the Arkansas River and its tributaries. The South Central Colorado Urban Area is the southernmost of the three primary subregions of the Front Range Urban Corridor.
This is a population history of the 272 active incorporated municipalities of the US State of Colorado since the 2000 United States census as estimated by the United States Census Bureau.