This article needs additional citations for verification .(May 2019) |
This page contains four lists of third-party and independent performances in United States presidential elections:
It is rare for candidates, other than those of the six parties which have succeeded as major parties (Federalist Party, Democratic-Republican Party, National Republican Party, Democratic Party, Whig Party, Republican Party), to take large shares of the vote in elections.
As of 2023 [update] , the last third party presidential candidate to win an electoral vote was George Wallace of the American Independent Party, who won five states in 1968. [1]
This list includes the third-party candidates that captured at least one state and/or more than 5% of the popular vote.
Year | Party | Nominee | Running-Mate | # Votes | % Votes | % Votes On Ballot | Electoral Votes | Place | Notes |
---|---|---|---|---|---|---|---|---|---|
1832 | Nullifier | John Floyd | Henry Lee | 0 [2] | 0 / 100 | N/A [2] | 11 / 286 | 3rd | |
Anti-Masonic | William Wirt | Amos Ellmaker | 99,817 | 7.78 / 100 | 15.93 / 100 | 7 / 286 | 4th | ||
1848 | Free Soil | Martin Van Buren | Charles F. Adams | 291,475 | 10.13 / 100 | 13.79 / 100 | 0 / 290 | 3rd | |
1856 | American | Millard Fillmore | Andrew J. Donelson | 872,703 | 21.54 / 100 | 21.54 / 100 | 8 / 296 | ||
1860 | Lecompton Democratic | John C. Breckinridge | Joseph Lane | 851,844 | 18.20 / 100 | 22.04 / 100 | 72 / 303 | 2nd | |
Constitutional Union | John Bell | Edward Everett | 590,946 | 12.62 / 100 | 15.43 / 100 | 39 / 303 | 3rd | ||
1872 | Liberal Republican [3] | Horace Greeley | Benjamin Gratz Brown | 2,834,761 | 43.78 / 100 | 43.78 / 100 | 0 / 352 [4] | 2nd | |
1892 | Populist | James B. Weaver | James G. Field | 1,026,595 | 8.51 / 100 | 8.62 / 100 | 22 / 444 | 3rd | |
1912 | Progressive | Theodore Roosevelt | Hiram Johnson | 4,120,609 | 27.39 / 100 | 27.86 / 100 | 88 / 531 | 2nd | |
Socialist | Eugene V. Debs | Emil Seidel | 900,742 | 5.99 / 100 | 5.99 / 100 | 0 / 531 | 4th | ||
1924 | Progressive | Robert M. La Follette | Burton K. Wheeler | 4,833,821 | 16.62 / 100 | 16.69 / 100 | 13 / 531 | 3rd | |
1948 | States' Rights Democratic (Dixiecrat) | Strom Thurmond | Fielding L. Wright | 1,175,946 | 2.41 / 100 | 17.70 / 100 | 39 / 531 | ||
1968 | American Independent | George Wallace | Curtis LeMay | 9,901,118 | 13.53 / 100 | 13.56 / 100 | 46 / 538 | ||
1980 | Independent | John B. Anderson | Patrick Lucey | 5,719,850 | 6.61 / 100 | 6.61 / 100 | 0 / 538 | ||
1992 | Ross Perot | James Stockdale | 19,743,821 | 18.91 / 100 | 18.91 / 100 | 0 / 538 | |||
1996 | Reform | Pat Choate | 8,085,402 | 8.40 / 100 | 8.40 / 100 | 0 / 538 | |||
This list includes the third-party candidates that captured less than 5% but more than 1% of the popular vote and no electoral votes.
Year | Party | Nominee | Running mate | No. votes | % Votes | % Votes on ballot | Place | Note |
---|---|---|---|---|---|---|---|---|
1808 | Independent Democratic-Republican | James Monroe | - | 4,848 | 2.50 / 100 | 11.22 / 100 | 3rd | - |
1812 | Straight-Federalist | Rufus King | William R. Davie | 5,574 | 2.00 / 100 | 26.90 / 100 | - | |
1820 | Independent Democratic-Republican | DeWitt Clinton | - | 1,893 | 1.75 / 100 | 5.88 / 100 | - | |
1844 | Liberty | James G. Birney | Thomas Morris | 62,300 | 2.31 / 100 | 3.28 / 100 | [5] : 861 | |
1852 | Free Soil | John P. Hale | George W. Julian | 155,799 | 4.93 / 100 | 6.15 / 100 | - | |
1880 | Greenback | James B. Weaver | Barzillai J. Chambers | 308,578 | 3.35 / 100 | 3.45 / 100 | [6] : 1558 | |
1884 | Benjamin Butler | Absolom M. West | 175,370 | 1.74 / 100 | 2.16 / 100 | [6] : 1611 | ||
Prohibition | John St. John | William Daniel | 150,369 | 1.50 / 100 | 1.57 / 100 | 4th | [6] : 1611 | |
1888 | Clinton Fisk | John A. Brooks | 249,506 | 2.19 / 100 | 2.21 / 100 | 3rd | [6] : 1700 | |
Union Labor | Alson Streeter | Charles E. Cunningham | 146,935 | 1.29 / 100 | 1.54 / 100 | 4th | [6] : 1700 | |
1892 | Prohibition | John Bidwell | James Cranfill | 255,841 | 2.12 / 100 | 2.17 / 100 | [6] : 1784 | |
1900 | John G. Woolley | Henry B. Metcalf | 209,157 | 1.50 / 100 | 1.52 / 100 | 3rd | [7] : 1962 | |
1904 | Socialist | Eugene V. Debs | Benjamin Hanford | 402,895 | 2.98 / 100 | 2.98 / 100 | [7] : 2046 | |
Prohibition | Silas C. Swallow | George W. Carroll | 258,950 | 1.91 / 100 | 1.96 / 100 | 4th | [7] : 2046 | |
1908 | Socialist | Eugene V. Debs | Benjamin Hanford | 420,890 | 2.83 / 100 | 2.84 / 100 | 3rd | [7] : 2131 |
Prohibition | Eugene W. Chafin | Aaron S. Watkins | 252,511 | 1.70 / 100 | 1.80 / 100 | 4th | [7] : 2131 | |
1912 | 207,828 | 1.38 / 100 | 1.46 / 100 | 5th | [7] : 2242 | |||
1916 | Socialist | Allan L. Benson | George R. Kirkpatrick | 585,113 | 3.17 / 100 | 3.19 / 100 | 3rd | [7] : 2345 |
Prohibition | Frank Hanly | Ira Landrith | 220,506 | 1.19 / 100 | 1.24 / 100 | 4th | [7] : 2345 | |
1920 | Socialist | Eugene V. Debs | Seymour Stedman | 919,799 | 3.44 / 100 | 3.53 / 100 | 3rd | [7] : 2456 |
1932 | Socialist | Norman Thomas | James H. Maurer | 884,781 | 2.22 / 100 | 2.28 / 100 | [7] : 2806 | |
1936 | Union | William Lemke | Thomas C. O'Brien | 882,479 | 1.93 / 100 | 2.88 / 100 | [7] : 2914 | |
1948 | Progressive | Henry A. Wallace | Glen H. Taylor | 1,157,172 | 2.37 / 100 | 2.65 / 100 | 4th | [7] : 3211 |
1972 | American Independent | John G. Schmitz | Thomas J. Anderson | 1,100,868 | 1.42 / 100 | 1.79 / 100 | 3rd | - |
1980 | Libertarian | Ed Clark | David H. Koch | 921,128 | 1.06 / 100 | 1.06 / 100 | 4th | - |
2000 | Green | Ralph Nader | Winona LaDuke | 2,882,955 | 2.74 / 100 | 2.86 / 100 | 3rd | - |
2016 | Libertarian | Gary Johnson | William Weld | 4,484,244 | 3.28 / 100 | 3.28 / 100 | - | |
Green | Jill Stein | Ajamu Baraka | 1,454,244 | 1.06 / 100 | 1.16 / 100 | 4th | - | |
2020 | Libertarian | Jo Jorgensen | Spike Cohen | 1,865,620 | 1.18 / 100 | 1.18 / 100 | 3rd | [8] |
This list includes the statewide performance of third-party candidates not included in the lists above who accrued 5% or more of a state's popular vote.
Many third-party candidates have run under different affiliations in different states. They do this for many reasons, including laws restricting ballot access, cross-endorsements by other established parties, etc.[ citation needed ] In the list below, the party column shows which of a given candidate's affiliation(s) appeared on the ballot in which corresponding state(s).
(1832–1860) | ||||||||
---|---|---|---|---|---|---|---|---|
Year | State | Party | Nominee | Running mate | # Votes | % Votes | Place | Notes |
1832 | Connecticut | Anti-Masonic | William Wirt | Amos Ellmaker | 3,409 | 10.38 / 100 | 3rd | |
Massachusetts | 14,692 | 21.73 / 100 | 2nd | |||||
Pennsylvania | 66,689 | 42.04 / 100 | ||||||
Vermont | 13,106 | 40.79 / 100 | 1st | |||||
1844 | Maine | Liberty | James G. Birney | Thomas Morris | 4,836 | 5.69 / 100 | 3rd | |
Massachusetts | 10,830 | 8.20 / 100 | ||||||
Michigan | 3,639 | 6.53 / 100 | ||||||
New Hampshire | 4,161 | 8.46 / 100 | ||||||
Vermont | 3,970 | 8.13 / 100 | ||||||
1848 | Connecticut | Free Soil | Martin Van Buren | Charles Francis Adams Sr. | 5,005 | 8.02 / 100 | ||
Illinois | 15,702 | 12.60 / 100 | ||||||
Indiana | 8,100 | 5.30 / 100 | ||||||
Maine | 12,157 | 13.87 / 100 | ||||||
Massachusetts | 38,333 | 28.45 / 100 | 2nd | |||||
Michigan | 10,393 | 15.97 / 100 | 3rd | |||||
New Hampshire | 7,560 | 15.09 / 100 | ||||||
New York | 120,497 | 26.43 / 100 | 2nd | |||||
Ohio | 35,347 | 10.76 / 100 | 3rd | |||||
Rhode Island | 730 | 6.54 / 100 | ||||||
Vermont | 13,837 | 28.87 / 100 | 2nd | |||||
Wisconsin | 10,418 | 26.60 / 100 | 3rd | |||||
1852 | Illinois | John P. Hale | George Washington Julian | 9,863 | 6.36 / 100 | 3rd | ||
Maine | 8,030 | 9.77 / 100 | ||||||
Massachusetts | 28,023 | 22.05 / 100 | ||||||
Michigan | 7,237 | 8.73 / 100 | ||||||
New Hampshire | 6,546 | 12.95 / 100 | ||||||
Ohio | 31,732 | 8.98 / 100 | ||||||
Vermont | 8,621 | 19.64 / 100 | ||||||
Wisconsin | 8,814 | 13.63 / 100 | ||||||
Georgia | Union | Daniel Webster | Charles J. Jenkins | 5,324 | 8.50 / 100 | |||
1856 | Alabama | American | Millard Fillmore | Andrew Jackson Donelson | 28,552 | 37.92 / 100 | 2nd | |
Arkansas | 10,732 | 32.88 / 100 | ||||||
California | 36,195 | 32.83 / 100 | ||||||
Delaware | 6,275 | 42.99 / 100 | ||||||
Florida | 4,833 | 43.19 / 100 | ||||||
Georgia | 42,439 | 42.86 / 100 | ||||||
Illinois | 37,531 | 15.68 / 100 | 3rd | |||||
Indiana | 22,386 | 9.51 / 100 | ||||||
Iowa | 9,669 | 10.47 / 100 | ||||||
Kentucky | 67,416 | 47.46 / 100 | 2nd | |||||
Louisiana | 20,709 | 48.30 / 100 | ||||||
Maryland | 47,452 | 54.63 / 100 | 1st | |||||
Massachusetts | 19,626 | 11.54 / 100 | 3rd | |||||
Mississippi | Whig | 24,191 | 40.56 / 100 | 2nd | ||||
Missouri | American | 48,522 | 45.57 / 100 | |||||
New Jersey | 24,115 | 24.26 / 100 | 3rd | |||||
New York | 124,206 | 20.89 / 100 | ||||||
North Carolina | Whig | 36,720 | 43.22 / 100 | 2nd | ||||
Ohio | American | 28,126 | 7.28 / 100 | 3rd | ||||
Pennsylvania | 82,189 | 17.86 / 100 | ||||||
Rhode Island | 1,675 | 8.45 / 100 | ||||||
Tennessee | 63,878 | 47.82 / 100 | 2nd | |||||
Texas | 15,639 | 33.41 / 100 | ||||||
Virginia | 60,150 | 40.04 / 100 | ||||||
1860 | Alabama | Constitutional Democratic | John C. Breckinridge | Joseph Lane | 48,669 | 54.00 / 100 | 1st | |
Arkansas | 28,732 | 53.06 / 100 | ||||||
California | 33,969 | 28.35 / 100 | 3rd | |||||
Connecticut | 16,558 | 20.51 / 100 | ||||||
Delaware | 7,339 | 45.54 / 100 | 1st | |||||
Florida | 8,277 | 62.23 / 100 | ||||||
Georgia | 52,176 | 48.89 / 100 | ||||||
Kentucky | 53,143 | 36.35 / 100 | 2nd | |||||
Louisiana | 22,681 | 44.90 / 100 | 1st | |||||
Maine | 6,368 | 6.31 / 100 | 3rd | |||||
Maryland | 42,482 | 45.93 / 100 | 1st | |||||
Mississippi | 40,768 | 59.00 / 100 | ||||||
Missouri | 31,362 | 18.94 / 100 | 3rd | |||||
North Carolina | 48,486 | 50.51 / 100 | 1st | |||||
Oregon | 5,074 | 34.37 / 100 | 2nd | |||||
Pennsylvania | 178,871 | 37.54 / 100 | ||||||
Tennessee | 65,097 | 44.55 / 100 | ||||||
Texas | 47,548 | 75.49 / 100 | 1st | |||||
Virginia | 74,325 | 44.54 / 100 | 2nd | |||||
Alabama | Constitutional Union | John Bell | Edward Everett | 27,835 | 30.89 / 100 | 2nd | ||
Arkansas | 20,063 | 37.05 / 100 | ||||||
California | 9,111 | 7.60 / 100 | 4th | |||||
Delaware | 3,888 | 24.13 / 100 | 2nd | |||||
Florida | 4,801 | 36.10 / 100 | ||||||
Georgia | 42,960 | 40.26 / 100 | ||||||
Kentucky | 66,058 | 45.18 / 100 | 1st | |||||
Louisiana | 20,204 | 40.00 / 100 | 2nd | |||||
Maryland | 41,760 | 45.14 / 100 | ||||||
Massachusetts | 22,331 | 13.15 / 100 | 3rd | |||||
Mississippi | 25,045 | 36.25 / 100 | 2nd | |||||
Missouri | 58,372 | 35.26 / 100 | ||||||
North Carolina | 45,129 | 46.66 / 100 | ||||||
Tennessee | 69,728 | 47.72 / 100 | 1st | |||||
Texas | 15,438 | 24.51 / 100 | 2nd | |||||
Virginia | 74,481 | 44.63 / 100 | 1st | |||||
(1864–1900) | ||||||||
---|---|---|---|---|---|---|---|---|
Year | State | Party | Nominee | Running mate | # Votes | % Votes | Place | Notes |
1876 | Kansas | Greenback | Peter Cooper | Samuel Fenton Cary | 7,770 | 6.26 / 100 | 3rd | |
1880 | Iowa | James B. Weaver | Barzillai J. Chambers | 32,327 | 10.02 / 100 | |||
Kansas | 19,851 | 9.86 / 100 | ||||||
Michigan | 34,895 | 9.88 / 100 | ||||||
Missouri | 35,042 | 8.82 / 100 | ||||||
Texas | 27,405 | 11.34 / 100 | ||||||
West Virginia | 9,008 | 8.00 / 100 | ||||||
1884 | Kansas | Benjamin Butler | Absolom M. West | 16,364 | 6.15 / 100 | |||
Massachusetts | 24,382 | 8.04 / 100 | ||||||
1888 | Minnesota | Prohibition | Clinton B. Fisk | John A. Brooks | 15,311 | 5.82 / 100 | ||
Arkansas | Union Labor | Alson Streeter | Charles E. Cunningham | 10,630 | 6.77 / 100 | |||
Kansas | 37,788 | 11.41 / 100 | ||||||
Texas | 29,459 | 8.24 / 100 | ||||||
1892 | Alabama | People's | James B. Weaver | James G. Field | 84,984 | 36.55 / 100 | 2nd | |
Arkansas | 11,831 | 7.99 / 100 | 3rd | |||||
California | 25,311 | 9.39 / 100 | ||||||
Colorado | 53,584 | 57.07 / 100 | 1st | |||||
Florida | 4,843 | 13.65 / 100 | 2nd | |||||
Georgia | 41,939 | 18.80 / 100 | 3rd | |||||
Idaho | 10,520 | 54.21 / 100 | 1st | |||||
Kansas | 163,111 | 50.20 / 100 | ||||||
Kentucky | 23,500 | 6.89 / 100 | 3rd | |||||
Minnesota | Fusion | 29,313 | 10.97 / 100 | |||||
Mississippi | People's | 10,118 | 19.27 / 100 | 2nd | ||||
Missouri | 41,204 | 7.61 / 100 | 3rd | |||||
Montana | 7,338 | 16.50 / 100 | ||||||
Nebraska | 83,134 | 41.53 / 100 | 2nd | |||||
Nevada | 7,264 | 66.78 / 100 | 1st | |||||
North Carolina | 44,336 | 15.82 / 100 | 3rd | |||||
North Dakota | 17,700 | 49.01 / 100 | 1st | |||||
Oregon | 26,965 | 34.35 / 100 | 2nd | |||||
South Dakota | Independent | 26,544 | 37.64 / 100 | |||||
Tennessee | People's | 23,918 | 9.00 / 100 | 3rd | ||||
Texas | 99,688 | 23.61 / 100 | 2nd | |||||
Washington | 19,165 | 21.79 / 100 | 3rd | |||||
Wyoming | Democratic | 7,722 | 46.14 / 100 | 2nd | ||||
Minnesota | Prohibition | John Bidwell | James B. Cranfill | 14,182 | 5.31 / 100 | 4th | ||
1900 | Florida | John G. Woolley | Henry B. Metcalf | 2,244 | 5.66 / 100 | 3rd | ||
(1904–1940) | ||||||||
---|---|---|---|---|---|---|---|---|
Year | State | Party | Nominee | Running mate | # Votes | % Votes | Place | Notes |
1904 | California | Socialist | Eugene V. Debs | Ben Hanford | 29,535 | 8.90 / 100 | 3rd | |
Florida | 2,337 | 5.95 / 100 | ||||||
Idaho | 4,949 | 6.82 / 100 | ||||||
Illinois | 69,225 | 6.43 / 100 | ||||||
Montana | 5,676 | 8.81 / 100 | ||||||
Nevada | 925 | 7.64 / 100 | ||||||
Oregon | 7,619 | 8.45 / 100 | ||||||
Utah | 5,767 | 5.67 / 100 | ||||||
Washington | 10,023 | 6.91 / 100 | ||||||
Wisconsin | Social Democratic | 28,240 | 6.37 / 100 | |||||
Georgia | People's | Thomas E. Watson | Thomas Tibbles | 22,635 | 17.28 / 100 | |||
Nebraska | 20,518 | 9.09 / 100 | ||||||
1908 | California | Socialist | Eugene V. Debs | Ben Hanford | 28,659 | 7.41 / 100 | ||
Florida | 3,747 | 7.59 / 100 | ||||||
Idaho | 6,400 | 6.58 / 100 | ||||||
Montana | 5,855 | 8.51 / 100 | ||||||
Nevada | 2,103 | 8.57 / 100 | ||||||
Oklahoma | 21,734 | 8.52 / 100 | ||||||
Oregon | 7,339 | 6.62 / 100 | ||||||
Washington | 14,177 | 7.71 / 100 | ||||||
Wisconsin | Social Democratic | 28,147 | 6.19 / 100 | |||||
Georgia | People's | Thomas E. Watson | Samuel Williams | 16,687 | 12.59 / 100 | |||
1912 | Alabama | Progressive | Theodore Roosevelt | Hiram Johnson | 22,680 | 19.24 / 100 | 2nd | |
Arizona | 6,949 | 29.29 / 100 | ||||||
Arkansas | 21,644 | 17.30 / 100 | 3rd | |||||
California | Republican | 283,610 | 41.83 / 100 | 1st | ||||
Colorado | Progressive | 72,306 | 27.09 / 100 | 2nd | ||||
Connecticut | 34,129 | 17.92 / 100 | 3rd | |||||
Delaware | 8,886 | 18.25 / 100 | ||||||
Florida | 4,555 | 8.96 / 100 | ||||||
Georgia | 21,985 | 18.10 / 100 | 2nd | |||||
Idaho | 25,527 | 24.14 / 100 | 3rd | |||||
Illinois | 386,478 | 33.72 / 100 | 2nd | |||||
Indiana | 162,007 | 24.75 / 100 | ||||||
Iowa | 161,819 | 32.87 / 100 | ||||||
Kentucky | 101,766 | 22.48 / 100 | 3rd | |||||
Kansas | Independent | 120,210 | 32.88 / 100 | 2nd | ||||
Louisiana | Progressive | 9,283 | 11.71 / 100 | |||||
Maine | 48,495 | 37.41 / 100 | ||||||
Maryland | 57,789 | 24.91 / 100 | ||||||
Massachusetts | 142,228 | 29.14 / 100 | 3rd | |||||
Michigan | 214,584 | 38.95 / 100 | 1st | |||||
Minnesota | 125,856 | 37.66 / 100 | ||||||
Mississippi | 3,459 | 5.50 / 100 | 2nd | |||||
Missouri | 124,375 | 17.80 / 100 | 3rd | |||||
Montana | 22,456 | 28.13 / 100 | 2nd | |||||
Nebraska | 72,681 | 29.13 / 100 | ||||||
Nevada | 5,620 | 27.94 / 100 | ||||||
New Hampshire | 17,794 | 20.23 / 100 | 3rd | |||||
New Jersey | 145,410 | 33.60 / 100 | 2nd | |||||
New Mexico | 8,347 | 16.90 / 100 | 3rd | |||||
New York | 390,093 | 24.56 / 100 | ||||||
North Carolina | 69,130 | 28.34 / 100 | 2nd | |||||
North Dakota | 25,726 | 29.71 / 100 | ||||||
Ohio | 229,807 | 22.16 / 100 | 3rd | |||||
Oregon | 37,600 | 27.44 / 100 | 2nd | |||||
Pennsylvania | 444,894 | 36.53 / 100 | 1st | |||||
Rhode Island | 16,878 | 21.67 / 100 | 3rd | |||||
South Dakota | Republican | 58,811 | 50.56 / 100 | 1st | ||||
Tennessee | Progressive | 54,041 | 21.45 / 100 | 3rd | ||||
Texas | 26,745 | 8.86 / 100 | ||||||
Utah | 24,174 | 21.51 / 100 | ||||||
Vermont | 22,132 | 35.22 / 100 | 2nd | |||||
Virginia | 21,777 | 15.90 / 100 | 3rd | |||||
Washington | 113,698 | 35.22 / 100 | 1st | |||||
West Virginia | 79,112 | 29.43 / 100 | 2nd | |||||
Wisconsin | 62,448 | 15.61 / 100 | 3rd | |||||
Wyoming | 9,232 | 21.83 / 100 | ||||||
Arizona | Socialist | Eugene V. Debs | Emil Seidel | 3,163 | 13.33 / 100 | |||
Arkansas | 8,153 | 6.52 / 100 | 4th | |||||
California | 79,201 | 11.68 / 100 | 3rd | |||||
Colorado | 16,418 | 6.15 / 100 | 4th | |||||
Connecticut | 10,056 | 5.28 / 100 | ||||||
Florida | 4,806 | 9.45 / 100 | 2nd | |||||
Idaho | 11,960 | 11.31 / 100 | 4th | |||||
Illinois | 81,278 | 7.09 / 100 | ||||||
Indiana | 36,931 | 5.64 / 100 | ||||||
Kansas | 26,779 | 7.33 / 100 | ||||||
Louisiana | 5,261 | 6.64 / 100 | 3rd | |||||
Minnesota | Public Ownership | 27,505 | 8.23 / 100 | 4th | ||||
Montana | Socialist | 10,885 | 13.64 / 100 | |||||
Nevada | 3,313 | 16.47 / 100 | 3rd | |||||
New Mexico | 2,859 | 5.79 / 100 | 4th | |||||
North Dakota | 6,966 | 8.05 / 100 | ||||||
Ohio | 90,144 | 8.69 / 100 | ||||||
Oklahoma | 41,674 | 16.42 / 100 | 3rd | |||||
Oregon | 13,343 | 9.74 / 100 | 4th | |||||
Pennsylvania | 83,614 | 6.87 / 100 | ||||||
Texas | 24,896 | 8.25 / 100 | ||||||
Utah | 9,023 | 8.03 / 100 | ||||||
Washington | 40,134 | 12.43 / 100 | ||||||
West Virginia | 15,248 | 5.67 / 100 | ||||||
Wisconsin | Social Democratic | 33,476 | 8.37 / 100 | |||||
Wyoming | Socialist | 2,760 | 6.53 / 100 | |||||
1916 | Arizona | Socialist | Allan L. Benson | George Ross Kirkpatrick | 3,174 | 5.47 / 100 | 3rd | |
Florida | 5,353 | 6.63 / 100 | ||||||
Idaho | 8,066 | 5.99 / 100 | ||||||
Minnesota | 20,117 | 5.19 / 100 | ||||||
Montana | 9,564 | 5.38 / 100 | ||||||
Nevada | 3,065 | 9.20 / 100 | ||||||
North Dakota | 5,716 | 4.95 / 100 | ||||||
Oklahoma | 45,190 | 15.45 / 100 | ||||||
Texas | 18,963 | 5.09 / 100 | ||||||
Washington | 22,800 | 5.98 / 100 | ||||||
Wisconsin | 27,631 | 6.18 / 100 | ||||||
Florida | Prohibition | Frank Hanly | Ira Landrith | 4,786 | 5.93 / 100 | 4th | ||
Georgia | Progressive | Unpledged | John M. Parker | 20,692 | 12.88 / 100 | 2nd | ||
Louisiana | 6,349 | 6.83 / 100 | 3rd | |||||
1920 | California | Socialist | Eugene V. Debs | Seymour Stedman | 64,076 | 6.79 / 100 | ||
Minnesota | 56,106 | 7.62 / 100 | ||||||
Nevada | 1,864 | 6.85 / 100 | ||||||
New York | 203,201 | 7.01 / 100 | ||||||
Oklahoma | 25,726 | 5.09 / 100 | ||||||
Wisconsin | 80,635 | 11.50 / 100 | ||||||
Montana | Farmer–Labor | Parley P. Christensen | Max S. Hayes | 12,204 | 6.82 / 100 | |||
South Dakota | Nonpartisan League | 34,707 | 19.04 / 100 | |||||
Washington | Farmer–Labor | 77,246 | 19.37 / 100 | |||||
Texas | American | James E. Ferguson | William Hough | 47,968 | 9.86 / 100 | 3rd | ||
Black & Tan Republican | Unpledged electors | 27,247 | 5.60 / 100 | 4th | ||||
1924 | Arizona | Progressive | Robert M. La Follette | Burton K. Wheeler | 17,210 | 23.27 / 100 | 3rd | |
Arkansas | 13,173 | 9.51 / 100 | ||||||
California | Socialist | 424,649 | 33.13 / 100 | 2nd | ||||
Colorado | La Follette-Wheeler Independent | 57,368 | 16.76 / 100 | 3rd | ||||
Farmer–Labor | 12,577 | 3.67 / 100 | ||||||
Total | 69,945 | 20.44 / 100 | ||||||
Connecticut | Progressive | 42,416 | 10.60 / 100 | |||||
Delaware | 4,979 | 5.48 / 100 | ||||||
Florida | 8,625 | 7.90 / 100 | ||||||
Georgia | 12,691 | 7.62 / 100 | ||||||
Idaho | 54,160 | 36.52 / 100 | 2nd | |||||
Illinois | 432,027 | 17.49 / 100 | 3rd | |||||
Indiana | 71,700 | 5.64 / 100 | ||||||
Iowa | 274,448 | 28.10 / 100 | 2nd | |||||
Kansas | Independent | 98,461 | 14.86 / 100 | 3rd | ||||
Maine | Progressive | 11,382 | 5.92 / 100 | |||||
Maryland | 47,157 | 13.15 / 100 | ||||||
Massachusetts | 141,225 | 12.50 / 100 | ||||||
Michigan | 122,014 | 10.51 / 100 | ||||||
Minnesota | Independent | 339,192 | 41.26 / 100 | 2nd | ||||
Missouri | Socialist | 84,160 | 6.43 / 100 | 3rd | ||||
Montana | Progressive | 66,123 | 37.91 / 100 | 2nd | ||||
Nebraska | 106,701 | 22.99 / 100 | 3rd | |||||
Nevada | Independent | 9,769 | 36.29 / 100 | 2nd | ||||
New Hampshire | Progressive | 8,993 | 5.46 / 100 | 3rd | ||||
New Jersey | 108,901 | 10.03 / 100 | ||||||
New Mexico | 9,543 | 8.46 / 100 | ||||||
New York | Socialist | 268,510 | 8.23 / 100 | |||||
Progressive | 206,395 | 6.32 / 100 | ||||||
Total | 474,905 | 14.55 / 100 | ||||||
North Dakota | Nonpartisan League | 89,922 | 45.17 / 100 | 2nd | ||||
Ohio | Progressive | 357,948 | 17.75 / 100 | 3rd | ||||
Oklahoma | Farmer–Labor | 46,375 | 8.78 / 100 | |||||
Oregon | Independent | 68,403 | 24.47 / 100 | 2nd | ||||
Pennsylvania | Farmer–Labor | 214,126 | 9.98 / 100 | 3rd | ||||
Socialist | 93,441 | 4.36 / 100 | ||||||
Total | 307,567 | 14.34 / 100 | ||||||
South Dakota | Independent | 75,355 | 36.96 / 100 | 2nd | ||||
Texas | Progressive | 42,881 | 6.52 / 100 | 3rd | ||||
Utah | 32,662 | 20.81 / 100 | ||||||
Vermont | 5,964 | 5.79 / 100 | ||||||
Washington | 150,727 | 35.76 / 100 | 2nd | |||||
West Virginia | Farmer–Labor | 36,723 | 6.29 / 100 | 3rd | ||||
Wisconsin | Independent | 453,678 | 53.96 / 100 | 1st | [9] | |||
Wyoming | Progressive | 25,174 | 31.51 / 100 | 2nd | ||||
Florida | Prohibition | Herman P. Faris | Marie C. Brehm | 5,498 | 5.04 / 100 | 4th | ||
1936 | Massachusetts | Union | William Lemke | Thomas C. O'Brien | 118,639 | 6.45 / 100 | 3rd | |
Minnesota | 74,296 | 6.58 / 100 | ||||||
North Dakota | 36,708 | 13.41 / 100 | ||||||
Oregon | Independent | 21,831 | 5.27 / 100 | |||||
Rhode Island | Union | 19,569 | 6.29 / 100 | |||||
(1944–1980) | ||||||||
---|---|---|---|---|---|---|---|---|
Year | State | Party | Nominee | Running mate | # Votes | % Votes | Place | Notes |
1944 | South Carolina | Southern Democratic | Unpledged electors | 7,799 | 7.54 / 100 | 2nd | ||
Texas | Texas Regulars | 135,439 | 11.77 / 100 | 3rd | ||||
1948 | Alabama | Democratic | Strom Thurmond | Fielding L. Wright | 171,443 | 79.75 / 100 | 1st | [10] |
Arkansas | States' Rights Democratic | 40,068 | 16.52 / 100 | 3rd | ||||
Florida | 89,755 | 15.54 / 100 | ||||||
Georgia | 85,055 | 20.31 / 100 | 2nd | |||||
Louisiana | 204,290 | 49.07 / 100 | 1st | [10] | ||||
Mississippi | Democratic | 167,538 | 87.17 / 100 | [10] | ||||
North Carolina | States' Rights Democratic | 69,652 | 8.80 / 100 | 3rd | ||||
South Carolina | 102,607 | 71.97 / 100 | 1st | [10] | ||||
Tennessee | 73,815 | 13.41 / 100 | 3rd | |||||
Texas | 113,776 | 9.11 / 100 | ||||||
Virginia | 43,393 | 10.35 / 100 | ||||||
New York | American Labor | Henry A. Wallace | Glen H. Taylor | 509,559 | 8.25 / 100 | |||
1956 | Louisiana | States' Rights Democratic | Unpledged electors | 44,520 | 7.21 / 100 | [11] | ||
Mississippi | 42,966 | 17.31 / 100 | ||||||
South Carolina | 88,511 | 29.45 / 100 | 2nd | |||||
Virginia | T. Coleman Andrews | Thomas H. Werdel | 42,964 | 6.16 / 100 | 3rd | |||
1960 | Alabama | Unpledged electors [12] | 324,050 | 36.47 / 100 | 1st | [11] [13] | ||
Louisiana | Independent | 169,572 | 20.99 / 100 | 3rd | ||||
Mississippi | 116,248 | 38.99 / 100 | 1st | [13] | ||||
Arkansas | National States' Rights | Orval Faubus | John G. Crommelin | 28,952 | 6.76 / 100 | 3rd | ||
1964 | Alabama | Democratic | Unpledged electors | 210,732 | 30.55 / 100 | 2nd | [11] | |
1968 | Alabama | George Wallace | Curtis LeMay (Official VP Nominee) | 691,425 | 65.86 / 100 | 1st | [14] | |
Alaska | Independent | 10,024 | 12.07 / 100 | 3rd | ||||
Arizona | American Independent | 46,573 | 9.56 / 100 | |||||
Arkansas | 235,627 | 38.65 / 100 | 1st | [14] | ||||
California | 487,270 | 6.72 / 100 | 3rd | |||||
Colorado | Marvin Griffin (Provisional VP Nominee) | 60,813 | 7.50 / 100 | |||||
Connecticut | Curtis LeMay (Official VP Nominee) | 76,650 | 6.10 / 100 | |||||
Delaware | 28,459 | 13.28 / 100 | ||||||
Florida | 676,794 | 28.53 / 100 | ||||||
Georgia | Marvin Griffin (Provisional VP Nominee) | 535,550 | 42.83 / 100 | 1st | [14] | |||
Idaho | Curtis LeMay (Official VP Nominee) | 36,541 | 12.55 / 100 | 3rd | ||||
Illinois | Independent | 390,958 | 8.46 / 100 | |||||
Indiana | American Independent | Marvin Griffin (Provisional VP Nominee) | 243,108 | 11.45 / 100 | ||||
Iowa | 66,422 | 5.69 / 100 | ||||||
Kansas | Conservative | 88,291 | 10.19 / 100 | |||||
Kentucky | American Independent | 193,098 | 18.29 / 100 | |||||
Louisiana | Curtis LeMay (Official VP Nominee) | 530,300 | 48.32 / 100 | 1st | [14] | |||
Maryland | Marvin Griffin (Provisional VP Nominee) | 178,734 | 14.47 / 100 | 3rd | ||||
Michigan | 331,968 | 10.04 / 100 | ||||||
Mississippi | Independent | Curtis LeMay (Official VP Nominee) | 415,349 | 63.46 / 100 | 1st | [14] | ||
Missouri | American Independent | Marvin Griffin (Provisional VP Nominee) | 206,126 | 11.39 / 100 | 3rd | |||
Montana | 20,015 | 7.29 / 100 | ||||||
Nebraska | 44,094 | 8.36 / 100 | ||||||
Nevada | 20,432 | 13.25 / 100 | ||||||
New Jersey | 262,187 | 9.12 / 100 | ||||||
New Mexico | 25,737 | 7.86 / 100 | ||||||
New York | Courage | 358,864 | 5.29 / 100 | |||||
North Carolina | American Independent | Curtis LeMay (Official VP Nominee) | 496,188 | 31.26 / 100 | 2nd | |||
North Dakota | Independent | 14,244 | 5.75 / 100 | 3rd | ||||
Ohio | American Independent | Marvin Griffin (Provisional VP Nominee) | 467,495 | 11.81 / 100 | ||||
Oklahoma | Curtis LeMay (Official VP Nominee) | 191,731 | 20.33 / 100 | |||||
Oregon | Independent | 49,683 | 6.06 / 100 | |||||
Pennsylvania | American Independent | Marvin Griffin (Provisional VP Nominee) | 378,582 | 7.97 / 100 | ||||
South Carolina | Independent | Curtis LeMay (Official VP Nominee) | 215,430 | 32.30 / 100 | 2nd | |||
Tennessee | American Independent | 424,792 | 34.02 / 100 | |||||
Texas | 584,269 | 18.97 / 100 | 3rd | |||||
Utah | 26,906 | 6.37 / 100 | ||||||
Virginia | 321,833 | 23.64 / 100 | ||||||
Washington | Marvin Griffin (Provisional VP Nominee) | 96,990 | 7.74 / 100 | |||||
West Virginia | 72,560 | 9.62 / 100 | ||||||
Wisconsin | Independent | 127,835 | 7.56 / 100 | |||||
Wyoming | 11,105 | 8.73 / 100 | ||||||
1972 | Alaska | American Independent | John G. Schmitz | Thomas J. Anderson | 6,903 | 7.25 / 100 | ||
Idaho | 28,869 | 9.30 / 100 | ||||||
Utah | 28,549 | 5.97 / 100 | ||||||
1976 | Alaska | Libertarian | Roger MacBride | David Bergland | 6,785 | 5.50 / 100 | ||
1980 | Alaska | Ed Clark | David Koch | 18,479 | 11.87 / 100 | [15] | ||
Independent | John B. Anderson | Patrick Lucey (Official VP Nominee) | 11,155 | 7.04 / 100 | 4th | [16] | ||
Arizona | 76,952 | 8.81 / 100 | 3rd | |||||
California | 739,833 | 8.62 / 100 | ||||||
Colorado | Anderson Coalition (Later National Unity) | 130,633 | 11.03 / 100 | |||||
Connecticut | 171,807 | 12.22 / 100 | ||||||
Delaware | 171,807 | 6.91 / 100 | ||||||
District of Columbia | Independent | 16,131 | 9.28 / 100 | |||||
Florida | 189,692 | 5.14 / 100 | ||||||
Hawaii | 32,021 | 10.56 / 100 | ||||||
Idaho | 27,058 | 6.19 / 100 | ||||||
Illinois | 346,754 | 7.30 / 100 | ||||||
Iowa | 115,633 | 8.78 / 100 | ||||||
Kansas | 68,231 | 6.96 / 100 | ||||||
Maine | 53,327 | 10.20 / 100 | ||||||
Maryland | 119,537 | 7.76 / 100 | ||||||
Massachusetts | Anderson Coalition (Later National Unity) | 382,539 | 15.15 / 100 | |||||
Michigan | 275,223 | 7.04 / 100 | ||||||
Minnesota | 174,990 | 8.53 / 100 | ||||||
Montana | Independent | 29,281 | 8.05 / 100 | |||||
Nebraska | 44,993 | 7.02 / 100 | ||||||
Nevada | 17,651 | 7.12 / 100 | ||||||
New Hampshire | 49,693 | 12.94 / 100 | ||||||
New Jersey | Anderson Coalition (Later National Unity) | 234,632 | 7.88 / 100 | |||||
New Mexico | Independent | 29,459 | 6.46 / 100 | |||||
New York | Liberal | 467,801 | 7.54 / 100 | |||||
North Dakota | Independent | 23,640 | 7.84 / 100 | |||||
Ohio | 254,472 | 5.94 / 100 | ||||||
Oregon | 112,389 | 9.51 / 100 | ||||||
Pennsylvania | Anderson Coalition (Later National Unity) | 292,921 | 6.42 / 100 | |||||
Rhode Island | 59,819 | 14.38 / 100 | ||||||
South Dakota | Independent | Flint (Provisional VP Nominee) | 21,431 | 6.54 / 100 | ||||
Utah | Patrick Lucey (Official VP Nominee) | 30,284 | 5.01 / 100 | |||||
Vermont | 31,760 | 14.90 / 100 | ||||||
Virginia | 95,418 | 5.11 / 100 | ||||||
Washington | 185,073 | 10.62 / 100 | ||||||
Wisconsin | 160,657 | 7.07 / 100 | ||||||
Wyoming | 12,072 | 6.83 / 100 | ||||||
(1984–Present) | ||||||||
---|---|---|---|---|---|---|---|---|
Year | State | Party | Nominee | Running mate | # Votes | % Votes | Place | Notes |
1992 | Alabama | Independent | Ross Perot | James Stockdale | 183,109 | 10.85 / 100 | 3rd | [17] |
Alaska | 73,481 | 28.43 / 100 | ||||||
Arizona | 353,741 | 23.79 / 100 | ||||||
Arkansas | 99,132 | 10.43 / 100 | ||||||
California | 2,296,006 | 20.63 / 100 | ||||||
Colorado | 366,010 | 23.32 / 100 | ||||||
Connecticut | Americans for Perot (Later Reform Party) | 348,771 | 21.58 / 100 | |||||
Delaware | Independent | 59,213 | 20.45 / 100 | |||||
Florida | 1,053,067 | 19.82 / 100 | ||||||
Georgia | 353,741 | 23.79 / 100 | ||||||
Hawaii | 53,003 | 14.22 / 100 | ||||||
Idaho | 130,395 | 27.05 / 100 | ||||||
Illinois | 840,515 | 16.64 / 100 | ||||||
Indiana | 455,934 | 19.77 / 100 | ||||||
Iowa | 253,468 | 18.71 / 100 | ||||||
Kansas | 312,358 | 26.99 / 100 | ||||||
Kentucky | 203,944 | 13.66 / 100 | ||||||
Louisiana | Prudence, Action, Results (Later Reform Party) | 211,478 | 11.81 / 100 | |||||
Maine | Independent | 206,820 | 30.44 / 100 | 2nd | [18] | |||
Maryland | 281,414 | 14.18 / 100 | 3rd | |||||
Massachusetts | 632,312 | 22.80 / 100 | ||||||
Michigan | 824,813 | 19.30 / 100 | ||||||
Minnesota | 562,506 | 23.96 / 100 | ||||||
Mississippi | 85,626 | 8.72 / 100 | [19] | |||||
Missouri | 518,741 | 21.69 / 100 | ||||||
Montana | 107,225 | 26.12 / 100 | ||||||
Nebraska | 174,687 | 23.63 / 100 | ||||||
Nevada | 132,580 | 26.19 / 100 | ||||||
New Hampshire | 121,337 | 22.59 / 100 | ||||||
New Jersey | 521,829 | 15.61 / 100 | ||||||
New Mexico | 91,895 | 16.12 / 100 | ||||||
New York | 1,090,721 | 15.75 / 100 | ||||||
North Carolina | 357,864 | 13.70 / 100 | ||||||
North Dakota | 71,084 | 23.07 / 100 | ||||||
Ohio | 1,036,426 | 20.98 / 100 | ||||||
Oklahoma | 319,878 | 23.01 / 100 | ||||||
Oregon | 354,091 | 24.21 / 100 | ||||||
Pennsylvania | Pennsylvanians (Later Reform Party) | 902,667 | 18.20 / 100 | |||||
Rhode Island | Perot for President (Later Reform Party) | 105,045 | 23.16 / 100 | |||||
South Carolina | Independent | 138,872 | 11.55 / 100 | |||||
South Dakota | 73,295 | 21.80 / 100 | ||||||
Tennessee | 199,968 | 10.09 / 100 | ||||||
Texas | 1,354,781 | 22.01 / 100 | ||||||
Utah | 203,400 | 27.34 / 100 | 2nd | [20] | ||||
Vermont | 65,991 | 22.78 / 100 | 3rd | |||||
Virginia | 348,639 | 13.63 / 100 | ||||||
Washington | 541,780 | 23.68 / 100 | ||||||
West Virginia | 108,829 | 15.91 / 100 | ||||||
Wisconsin | 544,479 | 21.51 / 100 | ||||||
Wyoming | 51,263 | 25.65 / 100 | ||||||
1996 | Alabama | Independent | Ross Perot | Pat Choate (Official VP Nominee) | 92,149 | 6.01 / 100 | [17] | |
Alaska | Reform | 26,333 | 10.90 / 100 | |||||
Arizona | 112,072 | 7.98 / 100 | ||||||
Arkansas | 69,884 | 7.90 / 100 | ||||||
California | James Campbell (Provisional VP Nominee) | 697,849 | 6.96 / 100 | |||||
Colorado | Pat Choate (Official VP Nominee) | 99,629 | 6.59 / 100 | |||||
Connecticut | 139,523 | 10.02 / 100 | ||||||
Delaware | Independent | 28,719 | 10.60 / 100 | |||||
Florida | Reform | 483,870 | 9.12 / 100 | |||||
Georgia | 146,337 | 6.37 / 100 | ||||||
Hawaii | 27,358 | 7.60 / 100 | ||||||
Idaho | 62,518 | 12.71 / 100 | ||||||
Illinois | 346,408 | 8.03 / 100 | ||||||
Indiana | James Campbell (Provisional VP Nominee) | 224,299 | 10.50 / 100 | |||||
Iowa | 105,159 | 8.52 / 100 | ||||||
Kansas | 92,639 | 8.62 / 100 | ||||||
Kentucky | Pat Choate (Official VP Nominee) | 120,396 | 8.67 / 100 | |||||
Louisiana | James Campbell (Provisional VP Nominee) | 123,293 | 6.91 / 100 | |||||
Maine | 85,970 | 14.19 / 100 | [21] | |||||
Maryland | 115,812 | 6.50 / 100 | ||||||
Massachusetts | Pat Choate (Official VP Nominee) | 227,217 | 8.89 / 100 | |||||
Michigan | 336,870 | 8.75 / 100 | ||||||
Minnesota | 257,704 | 11.75 / 100 | ||||||
Mississippi | Independent | 52,222 | 5.84 / 100 | |||||
Missouri | Reform | James Campbell (Provisional VP Nominee) | 217,188 | 10.06 / 100 | ||||
Montana | 55,229 | 13.56 / 100 | ||||||
Nebraska | Pat Choate (Official VP Nominee) | 71,278 | 10.52 / 100 | |||||
Nevada | 43,986 | 9.47 / 100 | ||||||
New Hampshire | 48,390 | 9.69 / 100 | ||||||
New Jersey | Independent | 262,134 | 8.52 / 100 | |||||
New Mexico | Reform | 32,257 | 5.80 / 100 | |||||
New York | Independence | 503,458 | 7.97 / 100 | |||||
North Carolina | Reform | 168,059 | 6.68 / 100 | |||||
North Dakota | Hanson (Provisional VP Nominee) | 32,515 | 12.20 / 100 | |||||
Ohio | James Campbell (Provisional VP Nominee) | 483,207 | 10.66 / 100 | |||||
Oklahoma | Pat Choate (Official VP Nominee) | 130,788 | 10.84 / 100 | |||||
Oregon | James Campbell (Provisional VP Nominee) | 121,221 | 8.80 / 100 | |||||
Pennsylvania | Pat Choate (Official VP Nominee) | 430,984 | 9.56 / 100 | |||||
Rhode Island | 43,723 | 11.20 / 100 | ||||||
South Carolina | 64,386 | 5.60 / 100 | ||||||
South Dakota | Independent | James Campbell (Provisional VP Nominee) | 31,250 | 9.65 / 100 | ||||
Tennessee | 105,918 | 5.59 / 100 | [22] | |||||
Texas | 378,537 | 6.75 / 100 | ||||||
Utah | Reform | Pat Choate (Official VP Nominee) | 66,461 | 9.98 / 100 | ||||
Vermont | 31,024 | 12.00 / 100 | ||||||
Virginia | 159,861 | 6.62 / 100 | ||||||
Washington | 201,003 | 8.92 / 100 | ||||||
West Virginia | 71,639 | 11.26 / 100 | ||||||
Wisconsin | 227,339 | 10.35 / 100 | ||||||
Wyoming | Independent | 25,928 | 12.25 / 100 | |||||
2000 | Alaska | Green | Ralph Nader | Winona LaDuke | 28,747 | 10.07 / 100 | [23] | |
Colorado | 91,434 | 5.25 / 100 | ||||||
Washington, D.C. | 10,576 | 5.24 / 100 | ||||||
Hawaii | 21,623 | 5.88 / 100 | ||||||
Maine | 37,127 | 5.70 / 100 | ||||||
Massachusetts | 173,564 | 6.42 / 100 | ||||||
Minnesota | 126,696 | 5.20 / 100 | ||||||
Montana | 24,437 | 5.95 / 100 | ||||||
Oregon | 77,357 | 5.04 / 100 | ||||||
Rhode Island | 25,052 | 6.12 / 100 | ||||||
Vermont | 20,374 | 6.92 / 100 | ||||||
2016 | Alaska | Libertarian | Gary Johnson | William Weld | 18,782 | 5.90 / 100 | 3rd | |
Colorado | 144,121 | 5.18 / 100 | ||||||
Maine | 37,578 | 5.10 / 100 | ||||||
Montana | 28,036 | 5.67 / 100 | ||||||
New Mexico | 74,541 | 9.34 / 100 | ||||||
North Dakota | 21,434 | 6.22 / 100 | ||||||
Oklahoma | 83,481 | 5.75 / 100 | ||||||
South Dakota | 20,845 | 5.63 / 100 | ||||||
Washington | 160,879 | 5.01 / 100 | ||||||
Wyoming | 13,287 | 5.19 / 100 | ||||||
Idaho | Independent | Evan McMullin | Nathan Johnson (Provisional VP Nominee) | 46,476 | 6.73 / 100 | |||
Utah | 243,685 | 21.54 / 100 | ||||||
Vermont | Write-in | Bernie Sanders | None | 18,183 | 5.67 / 100 | [24] | ||
This list includes the statewide performance of each major party candidate who ran on the ballot line of a political party other than their own, either through electoral fusion or for other reasons. This list does not include cases where a third party shares the same ballot line as a major party. The vote totals and percentages listed are those each candidate received under a particular third-party label.
Electoral fusion was once widespread in the United States. [25] As of 2022, electoral fusion as conventionally understood by historians and political scientists is fully legal in only two states: Connecticut and New York. It is partially legal in three others; Pennsylvania and Maryland permit fusion in certain elections (including judicial elections), and California allows fusion in presidential elections only. [26] [ page needed ]
The 1996 United States presidential election was the 53rd quadrennial presidential election, held on Tuesday, November 5, 1996. Incumbent Democratic President Bill Clinton defeated former Senate Majority Leader Bob Dole, the Republican nominee, and Ross Perot, the Reform Party nominee and 1992 Independent presidential candidate.
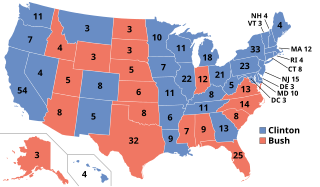
The 1992 United States presidential election was the 52nd quadrennial presidential election, held on Tuesday, November 3, 1992. Democratic Governor Bill Clinton of Arkansas defeated incumbent Republican President George H. W. Bush and independent businessman Ross Perot of Texas. The election marked the end of a period of Republican dominance in American presidential politics that began in 1968,, and also marked the end of 12 years of Republican rule of the White House, as well as the end of the Greatest Generation's 32-year American rule and the beginning of the baby boomers' 28-year dominance until 2020. It was the last time the incumbent president failed to win a second term until Donald Trump in 2020.
The 1860 United States presidential election was the 19th quadrennial presidential election, held on Tuesday, November 6, 1860. In a four-way contest, the Republican Party ticket of Abraham Lincoln and Hannibal Hamlin won a national popular plurality, a popular majority in the North where states already had abolished slavery, and a national electoral majority comprising only Northern electoral votes. Lincoln's election thus served as the main catalyst of the states that would become the Confederacy seceding from the Union. This marked the first time that a Republican was elected president. It was also the first presidential election in which both major party candidates were registered in the same home state; the others have been in 1904, 1920, 1940, 1944, and 2016.
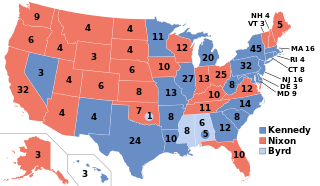
The 1960 United States presidential election was the 44th quadrennial presidential election. It was held on Tuesday, November 8, 1960. In a closely contested election, Democratic Senator John F. Kennedy defeated the incumbent Vice President Richard Nixon, the Republican nominee. This was the first election in which 50 states participated, marking the first participation of Alaska and Hawaii, and the last in which the District of Columbia did not. This made it the only presidential election where the threshold for victory was 269 electoral votes. It was also the first election in which an incumbent president –in this case, Dwight D. Eisenhower– was ineligible to run for a third term because of the term limits established by the 22nd Amendment.
Southern Democrats are affiliates of the U.S. Democratic Party who reside in the Southern United States.
In United States presidential elections, an unpledged elector is a person nominated to stand as an elector but who has not pledged to support any particular presidential or vice presidential candidate, and is free to vote for any candidate when elected a member of the Electoral College. Presidential elections are indirect, with voters in each state choosing electors on Election Day in November, and these electors choosing the president and vice president of the United States in December. Electors in practice have since the 19th century almost always agreed in advance to vote for a particular candidate — that is, they are said to have been pledged to that candidate. In several elections in the 20th century, however, competitive campaigns were mounted by candidates who made no pledge to any presidential nominee before the election. These anomalies largely arose from fissures within the Democratic Party over the issues of civil rights and segregation. No serious general election campaign has been mounted to elect unpledged electors in any state since 1964.
In the United States Electoral College, a faithless elector is an elector who does not vote for the candidates for U.S. President and U.S. Vice President for whom the elector had pledged to vote, and instead votes for another person for one or both offices or abstains from voting. As part of United States presidential elections, each state selects the method by which its electors are to be selected, which in modern times has been based on a popular vote in most states, and generally requires its electors to have pledged to vote for the candidates of their party if appointed. A pledged elector is only considered a faithless elector by breaking their pledge; unpledged electors have no pledge to break. The consequences of an elector voting in a way inconsistent with their pledge vary from state to state.
The National Democratic Party of Alabama (NDPA) was a political party active in the U.S. state of Alabama that opposed the segregationist governor George Wallace.
Richard Nixon served as the 37th president of the United States from 1969 to 1974. He previously served as the 36th vice president of the United States from 1953 to 1961, and as a United States senator from 1950 to 1953 and United States representative from 1947 to 1950.
The election of the president and the vice president of the United States is an indirect election in which citizens of the United States who are registered to vote in one of the fifty U.S. states or in Washington, D.C., cast ballots not directly for those offices, but instead for members of the Electoral College. These electors then cast direct votes, known as electoral votes, for president, and for vice president. The candidate who receives an absolute majority of electoral votes is then elected to that office. If no candidate receives an absolute majority of the votes for president, the House of Representatives elects the president; likewise if no one receives an absolute majority of the votes for vice president, then the Senate elects the vice president.
Following is a table of United States presidential elections in Louisiana, ordered by year. Since its admission to statehood in 1812, Louisiana has participated in every U.S. presidential election except the election of 1864, during the American Civil War. At that time, Louisiana was controlled by the Union and held elections, but electors were not ultimately counted.
Following is a table of United States presidential elections in New Hampshire, ordered by year. Since its admission to statehood in 1788, New Hampshire has participated in every U.S. presidential election.
The 1948 United States presidential election in Alabama was held on November 2, 1948. Alabama voters sent eleven electors to the Electoral College who voted for President and Vice-President. In Alabama, voters voted for electors individually instead of as a slate.
The 1968 United States presidential election in Mississippi was held on November 5, 1968. Mississippi voters chose seven electors, or representatives to the Electoral College, who voted for President and Vice-President.
The 1956 United States presidential election in Mississippi was held on November 6, 1956. Mississippi voters chose eight representatives, or electors to the Electoral College, who voted for president and vice president.
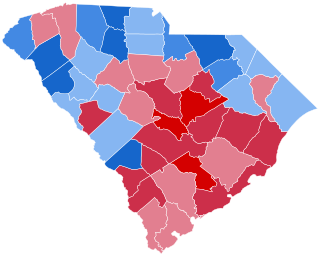
The 1956 United States presidential election in South Carolina took place on November 6, 1956, as part of the 1956 United States presidential election. South Carolina voters chose eight representatives, or electors, to the Electoral College, who voted for president and vice president.
The 1944 United States presidential election in South Carolina took place on November 7, 1944, as part of the 1944 United States presidential election. State voters chose 8 electors to the Electoral College, which selected the president and vice president.
The 1952 United States presidential election in South Carolina took place on November 4, 1952, as part of the 1952 United States presidential election. South Carolina voters chose 8 representatives, or electors, to the Electoral College, who voted for president and vice president.
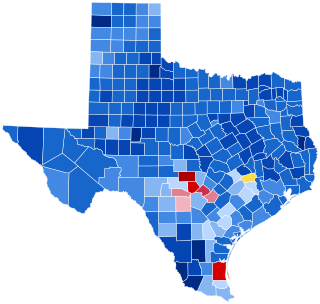
The 1944 United States presidential election in Texas took place on November 7, 1944, as part of the 1944 United States presidential election. State voters chose 23 electors to represent the state in the Electoral College, which chose the president and vice president.