| Annular eclipse | |
 Partial from Minneapolis, Minnesota | |
 Map | |
| Gamma | 0.4089 |
|---|---|
| Magnitude | 0.9681 |
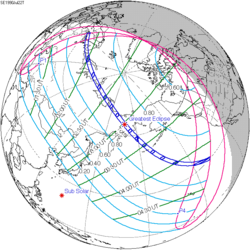
| Maximum eclipse | |
| Duration | 233 s (3 min 53 s) |
| Coordinates | 0°36′N130°42′W / 0.6°N 130.7°W |
| Max. width of band | 126 km (78 mi) |
| Times (UTC) | |
| Greatest eclipse | 20:53:01 |
| References | |
| Saros | 132 (45 of 71) |
| Catalog # (SE5000) | 9512 |
An annular solar eclipse occurred at the Moon's descending node of orbit on Friday, December 14, 2001, [1] [2] [3] [4] with a magnitude of 0.9681. A solar eclipse occurs when the Moon passes between Earth and the Sun, thereby totally or partly obscuring the image of the Sun for a viewer on Earth. An annular solar eclipse occurs when the Moon's apparent diameter is smaller than the Sun's, blocking most of the Sun's light and causing the Sun to look like an annulus (ring). An annular eclipse appears as a partial eclipse over a region of the Earth thousands of kilometres wide. The Moon's apparent diameter was near the average diameter because it occurred 7.9 days after perigee (on December 6, 2001, at 22:40 UTC) and 6.7 days before apogee (on December 21, 2001, at 13:00 UTC). [5]
Contents
- Observation
- Eclipse timing
- Places experiencing annular eclipse
- Places experiencing partial eclipse
- Gallery
- Eclipse season
- Related eclipses
- Eclipses in 2001
- Metonic
- Tzolkinex
- Half-Saros
- Tritos
- Solar Saros 132
- Inex
- Triad
- Solar eclipses of 2000–2003
- Saros 132
- Metonic series
- Tritos series
- Inex series
- Notes
- References
Annularity was visible across the Pacific Ocean, southern Costa Rica, northern Nicaragua and San Andrés Island, Colombia. The central shadow passed just south of Hawaii in early morning and ended over Central America near sunset. A partial eclipse was visible for parts of North America, Central America, northwestern South America, and Hawaii.


