Statistics of the COVID-19 pandemic in mainland China

Last updated

This article presents official statistics gathered during the COVID-19 pandemic in mainland China.

Contents

The case count in mainland China only includes symptomatic cases. It excludes patients who test positive but do not have symptoms, of which there were 889 as of 11 February 2020. [1] Asymptomatic infections are reported separately. [2] It is also reported that there were more than 43,000 by the end of February 2020. [3] [4] [5] On 17 April, following the Wuhan government's issuance of a report on accounting for COVID-19 deaths that occurred at home that went previously unreported, as well as the subtraction of deaths that were previously double-counted by different hospitals, the NHC retrospectively revised their cumulative totals dating to 16 April, adding 325 cumulative cases and 1,290 deaths. [6]

Around March 2020, there was speculation that China's COVID numbers were deliberately inaccurate, but as of 2021, China's COVID elimination strategy was considered[ by whom? ] to have been successful and its statistics were considered[ by whom? ] to be accurate.[ dubious ] [7] [8] [9]

By December 2022, the Chinese central government had changed its definition of reported death statistics to only include cases in which COVID-19 directly caused respiratory failure, [10] which led to skepticism by health experts of the government's total death count. [11] [12] The same month, the municipal health chief of Qingdao reported "between 490,000 and 530,000" new COVID-19 cases per day. [13]

China was part of a small group of countries such as Taiwan, Australia, New Zealand, and Singapore that pursued a zero-COVID strategy.[ citation needed ] The Chinese government's strategy involved extensive testing, mask wearing, temperature checks, ventilation, contact tracing, quarantines, isolation of infected people, and heavy restrictions in response to local outbreaks.

On December 25, 2022, the Chinese government's National Health Commission announced that it would no longer publish daily COVID-19 data. [14] In January 2023, the World Health Organization stated, "We believe that the current numbers being published from China under-represent the true impact of the disease in terms of hospital admissions, in terms of ICU admissions, and particularly in terms of deaths." [15]

Timeline

COVID-19 cases in Mainland China  ()
     Deaths        Recoveries        Tested        Clinically diagnosed (C.D.)        Tested or C.D.
20192019202020202021202120222022
DecDec
JanJanFebFebMarMarAprAprMayMayJunJunJulJulAugAugSepSepOctOctNovNovDecDec
JanJan
Last 15 daysLast 15 days
Date
Number of cases
(excluding C.D.)
Number of cases
(including C.D.)
2019-12-31
27(n.a.)
27(=)
2020-01-03
44(+63%)
2020-01-04
44(=)
2020-01-05
59(+34%)
59(=)
2020-01-10
41(n.a.)
2020-01-11
41(=)
2020-01-12
41(=)
41(=)
2020-01-15
41(=)
2020-01-16
45(+9.8%)
2020-01-17
62(+38%)
2020-01-18
121(+95%)
2020-01-19
198(+64%)
2020-01-20
291(+47%)
2020-01-21
440(+51%)
2020-01-22
571(+30%)
2020-01-23
830(+45%)
2020-01-24
1,287(+55%)
2020-01-25
1,975(+53%)
2020-01-26
2,744(+39%)
2020-01-27
4,515(+65%)
2020-01-28
5,974(+32%)
2020-01-29
7,711(+29%)
2020-01-30
9,692(+26%)
2020-01-31
11,791(+22%)
2020-02-01
14,380(+22%)
2020-02-02
17,205(+20%)
2020-02-03
20,438(+19%)
2020-02-04
24,324(+19%)
2020-02-05
28,018(+15%)
2020-02-06
31,161(+11%)
2020-02-07
34,546(+11%)
2020-02-08
37,198(+7.7%)
2020-02-09
40,171(+8%)
2020-02-10 [lower-roman 1]
42,638(+6.1%)48,315(n.a.)
2020-02-11
44,653(+4.7%)55,220(+14%)
2020-02-12 [lower-roman 2]
46,472(+4.1%)58,761(+6.4%)
2020-02-13
48,467(+4.3%)63,851(+8.7%)
2020-02-14
49,970(+3.1%)66,492(+4.1%)
2020-02-15
51,091(+2.2%)68,500(+3.0%)
2020-02-16
70,548(+3.0%)
2020-02-17
72,436(+2.7%)
2020-02-18 [lower-roman 3]
74,185(+2.4%)
2020-02-19 [lower-roman 4]
75,002(+1.1%)
2020-02-20
75,891(+1.2%)
2020-02-21
76,288(+0.52%)
2020-02-22
76,936(+0.85%)
2020-02-23
77,150(+0.28%)
2020-02-24
77,658(+0.66%)
2020-02-25
78,064(+0.52%)
2020-02-26
78,497(+0.55%)
2020-02-27
78,824(+0.42%)
2020-02-28
79,251(+0.54%)
2020-02-29
79,824(+0.72%)
2020-03-01
80,026(+0.25%)
2020-03-02
80,151(+0.16%)
2020-03-03
80,270(+0.15%)
2020-03-04
80,409(+0.17%)
2020-03-05
80,552(+0.18%)
2020-03-06
80,651(+0.12%)
2020-03-07
80,695(+0.05%)
2020-03-08
80,735(+0.05%)
2020-03-09
80,754(+0.02%)
2020-03-10
80,778(+0.03%)
2020-03-11
80,793(+0.02%)
2020-03-12
80,813(+0.02%)
2020-03-13
80,824(+0.01%)
2020-03-14
80,844(+0.02%)
2020-03-15
80,860(+0.02%)
2020-03-16
80,881(+0.03%)
2020-03-17
80,894(+0.02%)
2020-03-18
80,928(+0.04%)
2020-03-19
80,967(+0.05%)
2020-03-20
81,008(+0.05%)
2020-03-21
81,054(+0.06%)
2020-03-22
81,093(+0.05%)
2020-03-23
81,171(+0.1%)
2020-03-24
81,218(+0.06%)
2020-03-25
81,285(+0.08%)
2020-03-26
81,340(+0.07%)
2020-03-27
81,394(+0.07%)
2020-03-28
81,439(+0.06%)
2020-03-29
81,470(+0.04%)
2020-03-30
81,518(+0.06%)
2020-03-31
81,554(+0.04%)
2020-04-01
81,589(+0.04%)
2020-04-02
81,620(+0.04%)
2020-04-03
81,639(+0.02%)
2020-04-04
81,669(+0.04%)
2020-04-05
81,708(+0.05%)
2020-04-06
81,740(+0.04%)
2020-04-07
81,802(+0.08%)
2020-04-08
81,865(+0.08%)
2020-04-09
81,907(+0.05%)
2020-04-10
81,953(+0.06%)
2020-04-11
82,052(+0.12%)
2020-04-12
82,160(+0.13%)
2020-04-13
82,249(+0.11%)
2020-04-14
82,295(+0.06%)
2020-04-15
82,341(+0.06%)
2020-04-16
82,692(+0.43%)
2020-04-17
82,719(+0.03%)
2020-04-18
82,735(+0.02%)
2020-04-19
82,747(+0.01%)
2020-04-20
82,758(+0.01%)
2020-04-21
82,788(+0.04%)
2020-04-22
82,798(+0.01%)
2020-04-23
82,804(+0.01%)
2020-04-24
82,816(+0.01%)
2020-04-25
82,827(+0.01%)
2020-04-26
82,830(=)
2020-04-27
82,836(+0.01%)
2020-04-28
82,858(+0.03%)
2020-04-29
82,862(=)
2020-04-30
82,874(+0.01%)
2020-05-01
82,875(=)
2020-05-02
82,877(=)
2020-05-03
82,880(=)
2020-05-04
82,881(=)
2020-05-05
82,883(=)
2020-05-06
82,885(=)
2020-05-07
82,886(=)
2020-05-08
82,887(=)
2020-05-09
82,901(+0.02%)
2020-05-10
82,918(+0.02%)
2020-05-11
82,919(=)
2020-05-12
82,926(+0.01%)
2020-05-13
82,929(=)
2020-05-14
82,933(=)
2020-05-15
82,941(+0.01%)
2020-05-16
82,947(+0.01%)
2020-05-17
82,954(+0.01%)
2020-05-18
82,960(+0.01%)
2020-05-19
82,965(+0.01%)
2020-05-20
82,967(=)
2020-05-21
82,971(=)
2020-05-22
82,971(=)
2020-05-23
82,974(=)
2020-05-24
82,985(+0.01%)
2020-05-25
82,992(+0.01%)
2020-05-26
82,993(=)
2020-05-27
82,995(=)
2020-05-28
82,995(=)
2020-05-29
82,999(=)
2020-05-30
83,001(=)
2020-05-31
83,017(+0.02%)
2020-06-01
83,022(+0.01%)
2020-06-02
83,021(=)
2020-06-03
83,022(=)
2020-06-04
83,027(+0.01%)
2020-06-05
83,030(=)
2020-06-06
83,036(+0.01%)
2020-06-07
83,040(=)
2020-06-08
83,043(=)
2020-06-09
83,046(=)
2020-06-10
83,057(+0.01%)
2020-06-11
83,064(+0.01%)
2020-06-12
83,075(+0.01%)
2020-06-13
83,132(+0.07%)
2020-06-14
83,181(+0.06%)
2020-06-15
83,221(+0.05%)
2020-06-16
83,265(+0.05%)
2020-06-17
83,293(+0.03%)
2020-06-18
83,325(+0.04%)
2020-06-19
83,352(+0.03%)
2020-06-20
83,378(+0.03%)
2020-06-21
83,396(+0.02%)
2020-06-22
83,418(+0.03%)
2020-06-23
83,430(+0.01%)
2020-06-24
83,449(+0.02%)
2020-06-25
83,462(+0.02%)
2020-06-26
83,483(+0.03%)
2020-06-27
83,500(+0.02%)
2020-06-28
83,512(+0.01%)
2020-06-29
83,531(+0.02%)
2020-06-30
83,534(=)
2020-07-01
83,537(=)
2020-07-02
83,542(+0.01%)
2020-07-03
83,545(=)
2020-07-04
83,553(+0.01%)
2020-07-05
83,557(=)
2020-07-06
83,565(+0.01%)
2020-07-07
83,572(+0.01%)
2020-07-08
83,581(+0.01%)
2020-07-09
83,585(=)
2020-07-10
83,587(=)
2020-07-11
83,594(+0.01%)
2020-07-12
83,602(+0.01%)
2020-07-13
83,605(=)
2020-07-14
83,611(+0.01%)
2020-07-15
83,612(=)
2020-07-16
83,622(+0.01%)
2020-07-17
83,644(+0.03%)
2020-07-18
83,660(+0.02%)
2020-07-19
83,682(+0.03%)
2020-07-20
83,693(+0.01%)
2020-07-21
83,707(+0.02%)
2020-07-22
83,729(+0.03%)
2020-07-23
83,750(+0.03%)
2020-07-24
83,784(+0.04%)
2020-07-25
83,830(+0.05%)
2020-07-26
83,891(+0.07%)
2020-07-27
83,959(+0.08%)
2020-07-28
84,060(+0.12%)
2020-07-29
84,165(+0.12%)
2020-07-30
84,292(+0.15%)
2020-07-31
84,337(+0.05%)
2020-08-01
84,385(+0.06%)
2020-08-02
84,428(+0.05%)
2020-08-03
84,464(+0.04%)
2020-08-04
84,491(+0.03%)
2020-08-05
84,528(+0.04%)
2020-08-06
84,565(+0.04%)
2020-08-07
84,596(+0.04%)
2020-08-08
84,619(+0.03%)
2020-08-09
84,668(+0.06%)
2020-08-10
84,712(+0.05%)
2020-08-11
84,737(+0.03%)
2020-08-12
84,756(+0.02%)
2020-08-13
84,786(+0.04%)
2020-08-14
84,808(+0.03%)
2020-08-15
84,827(+0.02%)
2020-08-16
84,849(+0.03%)
2020-08-17
84,871(+0.03%)
2020-08-18
84,888(+0.02%)
2020-08-19
84,895(+0.01%)
2020-08-20
84,917(+0.03%)
2020-08-21
84,939(+0.03%)
2020-08-22
84,951(+0.01%)
2020-08-23
84,967(+0.02%)
2020-08-24
84,981(+0.02%)
2020-08-25
84,996(+0.02%)
2020-08-26
85,004(+0.01%)
2020-08-27
85,013(+0.01%)
2020-08-28
85,022(+0.01%)
2020-08-29
85,031(+0.01%)
2020-08-30
85,048(+0.02%)
2020-08-31
85,058(+0.01%)
2020-09-01
85,066(+0.01%)
2020-09-02
85,077(+0.01%)
2020-09-03
85,102(+0.03%)
2020-09-04
85,112(+0.01%)
2020-09-05
85,122(+0.01%)
2020-09-06
85,134(+0.01%)
2020-09-07
85,144(+0.01%)
2020-09-08
85,146(=)
2020-09-09
85,153(+0.01%)
2020-09-10
85,168(+0.02%)
2020-09-11
85,174(+0.01%)
2020-09-12
85,184(+0.01%)
2020-09-13
85,194(+0.01%)
2020-09-14
85,202(+0.01%)
2020-09-15
85,214(+0.01%)
2020-09-16
85,223(+0.01%)
2020-09-17
85,255(+0.04%)
2020-09-18
85,269(+0.02%)
2020-09-19
85,279(+0.01%)
2020-09-20
85,291(+0.01%)
2020-09-21
85,297(+0.01%)
2020-09-22
85,307(+0.01%)
2020-09-23
85,314(+0.01%)
2020-09-24
85,322(+0.01%)
2020-09-25
85,337(+0.02%)
2020-09-26
85,351(+0.02%)
2020-09-27
85,372(+0.02%)
2020-09-28
85,384(+0.01%)
2020-09-29
85,403(+0.02%)
2020-09-30
85,414(+0.01%)
2020-10-01
85,424(+0.01%)
2020-10-02
85,434(+0.01%)
2020-10-03
85,450(+0.02%)
2020-10-04
85,470(+0.02%)
2020-10-05
85,482(+0.01%)
2020-10-06
85,489(+0.01%)
2020-10-07
85,500(+0.01%)
2020-10-08
85,521(+0.02%)
2020-10-09
85,536(+0.02%)
2020-10-10
85,557(+0.02%)
2020-10-11
85,578(+0.02%)
2020-10-12
85,591(+0.02%)
2020-10-13
85,611(+0.02%)
2020-10-14
85,622(+0.01%)
2020-10-15
85,646(+0.03%)
2020-10-16
85,659(+0.02%)
2020-10-17
85,672(+0.02%)
2020-10-18
85,685(+0.02%)
2020-10-19
85,704(+0.02%)
2020-10-20
85,715(+0.01%)
2020-10-21
85,729(+0.02%)
2020-10-22
85,747(+0.02%)
2020-10-23
85,775(+0.03%)
2020-10-24
85,790(+0.02%)
2020-10-25
85,810(+0.02%)
2020-10-26
85,826(+0.02%)
2020-10-27
85,868(+0.05%)
2020-10-28
85,915(+0.05%)
2020-10-29
85,940(+0.03%)
2020-10-30
85,973(+0.04%)
2020-10-31
85,997(+0.03%)
2020-11-01
86,021(+0.03%)
2020-11-02
86,070(+0.06%)
2020-11-03
86,087(+0.02%)
2020-11-04
86,115(+0.03%)
2020-11-05
86,151(+0.04%)
2020-11-06
86,184(+0.04%)
2020-11-07
86,212(+0.03%)
2020-11-08
86,245(+0.04%)
2020-11-09
86,267(+0.03%)
2020-11-10
86,284(+0.02%)
2020-11-11
86,299(+0.02%)
2020-11-12
86,307(+0.01%)
2020-11-13
86,325(+0.02%)
2020-11-14
86,338(+0.02%)
2020-11-15
86,346(+0.01%)
2020-11-16
86,361(+0.02%)
2020-11-17
86,369(+0.01%)
2020-11-18
86,381(+0.01%)
2020-11-19
86,398(+0.02%)
2020-11-20
86,414(+0.02%)
2020-11-21
86,431(+0.02%)
2020-11-22
86,442(+0.01%)
2020-11-23
86,464(+0.03%)
2020-11-24
86,469(+0.01%)
2020-11-25
86,490(+0.02%)
2020-11-26
86,495(+0.01%)
2020-11-27
86,501(+0.01%)
2020-11-28
86,512(+0.01%)
2020-11-29
86,530(+0.02%)
2020-11-30
86,542(+0.01%)
2020-12-01
86,551(+0.01%)
2020-12-02
86,567(+0.02%)
2020-12-03
86,584(+0.02%)
2020-12-04
86,601(+0.02%)
2020-12-05
86,619(+0.02%)
2020-12-06
86,634(+0.02%)
2020-12-07
86,646(+0.01%)
2020-12-08
86,661(+0.02%)
2020-12-09
86,673(+0.01%)
2020-12-10
86,688(+0.02%)
2020-12-11
86,701(+0.01%)
2020-12-12
86,725(+0.03%)
2020-12-13
86,741(+0.02%)
2020-12-14
86,758(+0.02%)
2020-12-15
86,770(+0.01%)
2020-12-16
86,777(+0.01%)
2020-12-17
86,789(+0.01%)
2020-12-18
86,806(+0.02%)
2020-12-19
86,829(+0.03%)
2020-12-20
86,852(+0.03%)
2020-12-21
86,867(+0.02%)
2020-12-22
86,882(+0.02%)
2020-12-23
86,899(+0.02%)
2020-12-24
86,913(+0.02%)
2020-12-25
86,933(+0.02%)
2020-12-26
86,955(+0.03%)
2020-12-27
86,976(+0.02%)
2020-12-28
87,003(+0.03%)
2020-12-29
87,027(+0.03%)
2020-12-30
87,052(+0.03%)
2020-12-31
87,071(+0.02%)
2021-01-01
87,093(+0.03%)
2021-01-02
87,117(+0.03%)
2021-01-03
87,150(+0.04%)
2021-01-04
87,183(+0.04%)
2021-01-05
87,215(+0.04%)
2021-01-06
87,278(+0.07%)
2021-01-07
87,331(+0.06%)
2021-01-08
87,364(+0.04%)
2021-01-09
87,433(+0.08%)
2021-01-10
87,536(+0.12%)
2021-01-11
87,591(+0.06%)
2021-01-12
87,706(+0.13%)
2021-01-13
87,844(+0.16%)
2021-01-14
87,988(+0.16%)
2021-01-15
88,118(+0.15%)
2021-01-16
88,227(+0.12%)
2021-01-17
88,336(+0.12%)
2021-01-18
88,454(+0.13%)
2021-01-19
88,557(+0.12%)
2021-01-20
88,701(+0.16%)
2021-01-21
88,804(+0.12%)
2021-01-22
88,911(+0.12%)
2021-01-23
88,991(+0.09%)
2021-01-24
89,115(+0.14%)
2021-01-25
89,197(+0.09%)
2021-01-26
89,272(+0.08%)
2021-01-27
89,326(+0.06%)
2021-01-28
89,378(+0.06%)
2021-01-29
89,430(+0.06%)
2021-01-30
89,522(+0.1%)
2021-01-31
89,564(+0.05%)
2021-02-01
89,594(+0.03%)
2021-02-02
89,619(+0.03%)
2021-02-03
89,649(+0.03%)
2021-02-04
89,669(+0.02%)
2021-02-05
89,681(+0.01%)
2021-02-06
89,692(+0.01%)
2021-02-07
89,706(+0.02%)
2021-02-08
89,720(+0.02%)
2021-02-09
89,734(+0.02%)
2021-02-10
89,736(=)
2021-02-11
89,748(+0.01%)
2021-02-12
89,756(+0.01%)
2021-02-13
89,763(+0.01%)
2021-02-14
89,772(+0.01%)
2021-02-15
89,788(+0.02%)
2021-02-16
89,795(+0.01%)
2021-02-17
89,806(+0.01%)
2021-02-18
89,816(+0.01%)
2021-02-19
89,824(+0.01%)
2021-02-20
89,831(+0.01%)
2021-02-21
89,842(+0.01%)
2021-02-22
89,852(+0.01%)
2021-02-23
89,864(+0.01%)
2021-02-24
89,871(+0.01%)
2021-02-25
89,877(+0.01%)
2021-02-26
89,887(+0.01%)
2021-02-27
89,893(+0.01%)
2021-02-28
89,912(+0.02%)
2021-03-01
89,923(+0.01%)
2021-03-02
89,933(+0.01%)
2021-03-03
89,943(+0.01%)
2021-03-04
89,952(+0.01%)
2021-03-05
89,962(+0.01%)
2021-03-06
89,975(+0.01%)
2021-03-07
89,994(+0.02%)
2021-03-08
90,002(+0.01%)
2021-03-09
90,007(+0.01%)
2021-03-10
90,018(+0.01%)
2021-03-11
90,027(+0.01%)
2021-03-12
90,034(+0.01%)
2021-03-13
90,044(+0.01%)
2021-03-14
90,049(+0.01%)
2021-03-15
90,062(+0.01%)
2021-03-16
90,066(=)
2021-03-17
90,072(+0.01%)
2021-03-18
90,083(+0.01%)
2021-03-19
90,087(=)
2021-03-20
90,099(+0.01%)
2021-03-21
90,106(+0.01%)
2021-03-22
90,115(+0.01%)
2021-03-23
90,125(+0.01%)
2021-03-24
90,136(+0.01%)
2021-03-25
90,147(+0.01%)
2021-03-26
90,159(+0.01%)
2021-03-27
90,167(+0.01%)
2021-03-28
90,182(+0.02%)
2021-03-29
90,190(+0.01%)
2021-03-30
90,201(+0.01%)
2021-03-31
90,217(+0.02%)
2021-04-01
90,226(+0.01%)
2021-04-02
90,252(+0.03%)
2021-04-03
90,273(+0.02%)
2021-04-04
90,305(+0.04%)
2021-04-05
90,329(+0.03%)
2021-04-06
90,341(+0.01%)
2021-04-07
90,365(+0.03%)
2021-04-08
90,386(+0.02%)
2021-04-09
90,400(+0.02%)
2021-04-10
90,410(+0.01%)
2021-04-11
90,426(+0.02%)
2021-04-12
90,435(+0.01%)
2021-04-13
90,447(+0.01%)
2021-04-14
90,457(+0.01%)
2021-04-15
90,468(+0.01%)
2021-04-16
90,483(+0.02%)
2021-04-17
90,499(+0.02%)
2021-04-18
90,510(+0.01%)
2021-04-19
90,520(+0.01%)
2021-04-20
90,541(+0.02%)
2021-04-21
90,547(+0.01%)
2021-04-22
90,566(+0.02%)
2021-04-23
90,575(+0.01%)
2021-04-24
90,588(+0.01%)
2021-04-25
90,599(+0.01%)
2021-04-26
90,610(+0.01%)
2021-04-27
90,622(+0.01%)
2021-04-28
90,642(+0.02%)
2021-04-29
90,655(+0.01%)
2021-04-30
90,671(+0.02%)
2021-05-01
90,686(+0.02%)
2021-05-02
90,697(+0.01%)
2021-05-03
90,714(+0.02%)
2021-05-04
90,721(+0.01%)
2021-05-05
90,726(+0.01%)
2021-05-06
90,739(+0.01%)
2021-05-07
90,746(+0.01%)
2021-05-08
90,758(+0.01%)
2021-05-09
90,769(+0.01%)
2021-05-10
90,783(+0.02%)
2021-05-11
90,799(+0.02%)
2021-05-12
90,808(+0.01%)
2021-05-13
90,815(+0.01%)
2021-05-14
90,829(+0.02%)
2021-05-15
90,847(+0.02%)
2021-05-16
90,872(+0.03%)
2021-05-17
90,894(+0.02%)
2021-05-18
90,908(+0.02%)
2021-05-19
90,920(+0.01%)
2021-05-20
90,944(+0.03%)
2021-05-21
90,954(+0.01%)
2021-05-22
90,973(+0.02%)
2021-05-23
90,991(+0.02%)
2021-05-24
91,006(+0.02%)
2021-05-25
91,019(+0.01%)
2021-05-26
91,038(+0.02%)
2021-05-27
91,045(+0.01%)
2021-05-28
91,061(+0.02%)
2021-05-29
91,072(+0.01%)
2021-05-30
91,099(+0.03%)
2021-05-31
91,122(+0.03%)
2021-06-01
91,146(+0.03%)
2021-06-02
91,170(+0.03%)
2021-06-03
91,194(+0.03%)
2021-06-04
91,218(+0.03%)
2021-06-05
91,248(+0.03%)
2021-06-06
91,267(+0.02%)
2021-06-07
91,300(+0.04%)
2021-06-08
91,316(+0.02%)
2021-06-09
91,337(+0.02%)
2021-06-10
91,359(+0.02%)
2021-06-11
91,394(+0.04%)
2021-06-12
91,428(+0.04%)
2021-06-13
91,451(+0.03%)
2021-06-14
91,471(+0.02%)
2021-06-15
91,492(+0.02%)
2021-06-16
91,511(+0.02%)
2021-06-17
91,534(+0.03%)
2021-06-18
91,564(+0.03%)
2021-06-19
91,587(+0.03%)
2021-06-20
91,604(+0.02%)
2021-06-21
91,629(+0.03%)
2021-06-22
91,653(+0.03%)
2021-06-23
91,669(+0.02%)
2021-06-24
91,693(+0.03%)
2021-06-25
91,718(+0.03%)
2021-06-26
91,732(+0.02%)
2021-06-27
91,753(+0.02%)
2021-06-28
91,771(+0.02%)
2021-06-29
91,780(+0.01%)
2021-06-30
91,792(+0.01%)
2021-07-01
91,810(+0.02%)
2021-07-02
91,833(+0.03%)
2021-07-03
91,847(+0.02%)
2021-07-04
91,869(+0.02%)
2021-07-05
91,892(+0.03%)
2021-07-06
91,949(+0.06%)
2021-07-07
91,966(+0.02%)
2021-07-08
91,989(+0.03%)
2021-07-09
92,015(+0.03%)
2021-07-10
92,039(+0.03%)
2021-07-11
92,066(+0.03%)
2021-07-12
92,095(+0.03%)
2021-07-13
92,119(+0.03%)
2021-07-14
92,147(+0.03%)
2021-07-15
92,183(+0.04%)
2021-07-16
92,213(+0.03%)
2021-07-17
92,246(+0.04%)
2021-07-18
92,277(+0.03%)
2021-07-19
92,342(+0.07%)
2021-07-20
92,364(+0.02%)
2021-07-21
92,414(+0.05%)
2021-07-22
92,462(+0.05%)
2021-07-23
92,497(+0.04%)
2021-07-24
92,529(+0.03%)
2021-07-25
92,605(+0.08%)
2021-07-26
92,676(+0.08%)
2021-07-27
92,762(+0.09%)
2021-07-28
92,811(+0.05%)
2021-07-29
92,875(+0.07%)
2021-07-30
92,930(+0.06%)
2021-07-31
93,005(+0.08%)
2021-08-01
93,103(+0.11%)
2021-08-02
93,193(+0.1%)
2021-08-03
93,289(+0.1%)
2021-08-04
93,374(+0.09%)
2021-08-05
93,498(+0.13%)
2021-08-06
93,605(+0.11%)
2021-08-07
93,701(+0.1%)
2021-08-08
93,826(+0.13%)
2021-08-09
93,969(+0.15%)
2021-08-10
94,080(+0.12%)
2021-08-11
94,161(+0.09%)
2021-08-12
94,260(+0.11%)
2021-08-13
94,326(+0.07%)
2021-08-14
94,379(+0.06%)
2021-08-15
94,430(+0.05%)
2021-08-16
94,472(+0.04%)
2021-08-17
94,500(+0.03%)
2021-08-18
94,546(+0.05%)
2021-08-19
94,579(+0.03%)
2021-08-20
94,599(+0.02%)
2021-08-21
94,631(+0.03%)
2021-08-22
94,652(+0.02%)
2021-08-23
94,687(+0.04%)
2021-08-24
94,707(+0.02%)
2021-08-25
94,733(+0.03%)
2021-08-26
94,765(+0.03%)
2021-08-27
94,786(+0.02%)
2021-08-28
94,819(+0.03%)
2021-08-29
94,842(+0.02%)
2021-08-30
94,879(+0.04%)
2021-08-31
94,898(+0.02%)
2021-09-01
94,926(+0.03%)
2021-09-02
94,954(+0.03%)
2021-09-03
94,982(+0.03%)
2021-09-04
95,010(+0.03%)
2021-09-05
95,028(+0.02%)
2021-09-06
95,064(+0.04%)
2021-09-07
95,083(+0.02%)
2021-09-08
95,111(+0.03%)
2021-09-09
95,128(+0.02%)
2021-09-10
95,153(+0.03%)
2021-09-11
95,199(+0.05%)
2021-09-12
95,248(+0.05%)
2021-09-13
95,340(+0.1%)
2021-09-14
95,413(+0.08%)
2021-09-15
95,493(+0.08%)
2021-09-16
95,577(+0.09%)
2021-09-17
95,623(+0.05%)
2021-09-18
95,689(+0.07%)
2021-09-19
95,738(+0.05%)
2021-09-20
95,810(+0.08%)
2021-09-21
95,851(+0.04%)
2021-09-22
95,894(+0.04%)
2021-09-23
95,948(+0.06%)
2021-09-24
95,986(+0.04%)
2021-09-25
96,015(+0.03%)
2021-09-26
96,050(+0.04%)
2021-09-27
96,081(+0.03%)
2021-09-28
96,106(+0.03%)
2021-09-29
96,128(+0.02%)
2021-09-30
96,162(+0.04%)
2021-10-01
96,203(+0.04%)
2021-10-02
96,231(+0.03%)
2021-10-03
96,258(+0.03%)
2021-10-04
96,284(+0.03%)
2021-10-05
96,310(+0.03%)
2021-10-06
96,335(+0.03%)
2021-10-07
96,357(+0.02%)
2021-10-08
96,374(+0.02%)
2021-10-09
96,398(+0.02%)
2021-10-10
96,423(+0.03%)
2021-10-11
96,435(+0.01%)
2021-10-12
96,457(+0.02%)
2021-10-13
96,478(+0.02%)
2021-10-14
96,488(+0.01%)
2021-10-15
96,502(+0.01%)
2021-10-16
96,522(+0.02%)
2021-10-17
96,546(+0.02%)
2021-10-18
96,571(+0.03%)
2021-10-19
96,601(+0.03%)
2021-10-20
96,622(+0.02%)
2021-10-21
96,665(+0.04%)
2021-10-22
96,715(+0.05%)
2021-10-23
96,758(+0.04%)
2021-10-24
96,797(+0.04%)
2021-10-25
96,840(+0.04%)
2021-10-26
96,899(+0.06%)
2021-10-27
96,938(+0.04%)
2021-10-28
97,002(+0.07%)
2021-10-29
97,080(+0.08%)
2021-10-30
97,151(+0.07%)
2021-10-31
97,243(+0.09%)
2021-11-01
97,314(+0.07%)
2021-11-02
97,423(+0.11%)
2021-11-03
97,527(+0.11%)
2021-11-04
97,605(+0.08%)
2021-11-05
97,660(+0.06%)
2021-11-06
97,734(+0.08%)
2021-11-07
97,823(+0.09%)
2021-11-08
97,885(+0.06%)
2021-11-09
97,939(+0.06%)
2021-11-10
98,001(+0.06%)
2021-11-11
98,099(+0.1%)
2021-11-12
98,174(+0.08%)
2021-11-13
98,263(+0.09%)
2021-11-14
98,315(+0.05%)
2021-11-15
98,337(+0.02%)
2021-11-16
98,368(+0.03%)
2021-11-17
98,403(+0.04%)
2021-11-18
98,427(+0.02%)
2021-11-19
98,450(+0.02%)
2021-11-20
98,467(+0.02%)
2021-11-21
98,505(+0.04%)
2021-11-22
98,524(+0.02%)
2021-11-23
98,546(+0.02%)
2021-11-24
98,570(+0.02%)
2021-11-25
98,583(+0.01%)
2021-11-26
98,608(+0.03%)
2021-11-27
98,631(+0.02%)
2021-11-28
98,672(+0.04%)
2021-11-29
98,711(+0.04%)
2021-11-30
98,824(+0.11%)
2021-12-01
98,897(+0.07%)
2021-12-02
98,993(+0.1%)
2021-12-03
99,083(+0.09%)
2021-12-04
99,142(+0.06%)
2021-12-05
99,203(+0.06%)
2021-12-06
99,297(+0.09%)
2021-12-07
99,371(+0.07%)
2021-12-08
99,454(+0.08%)
2021-12-09
99,517(+0.06%)
2021-12-10
99,604(+0.09%)
2021-12-11
99,679(+0.08%)
2021-12-12
99,780(+0.1%)
2021-12-13
99,856(+0.08%)
2021-12-14
99,923(+0.07%)
2021-12-15
100,000(+0.08%)
2021-12-16
100,076(+0.08%)
2021-12-17
100,201(+0.12%)
2021-12-18
100,284(+0.08%)
2021-12-19
100,386(+0.1%)
2021-12-20
100,467(+0.08%)
2021-12-21
100,544(+0.08%)
2021-12-22
100,644(+0.1%)
2021-12-23
100,731(+0.09%)
2021-12-24
100,871(+0.14%)
2021-12-25
101,077(+0.2%)
2021-12-26
101,277(+0.2%)
2021-12-27
101,486(+0.21%)
2021-12-28
101,683(+0.19%)
2021-12-29
101,890(+0.2%)
2021-12-30
102,083(+0.19%)
2021-12-31
102,314(+0.23%)
2022-01-01
102,505(+0.19%)
2022-01-02
102,666(+0.16%)
2022-01-03
102,841(+0.17%)
2022-01-04
102,932(+0.09%)
2022-01-05
103,121(+0.18%)
2022-01-06
103,295(+0.17%)
2022-01-07
103,454(+0.15%)
2022-01-08
103,619(+0.16%)
2022-01-09
103,776(+0.15%)
2022-01-10
103,968(+0.19%)
2022-01-11
104,189(+0.21%)
2022-01-12
104,379(+0.18%)
2022-01-13
104,580(+0.19%)
2022-01-14
104,745(+0.16%)
2022-01-15
104,864(+0.11%)
2022-01-16
105,087(+0.21%)
2022-01-17
105,258(+0.16%)
2022-01-18
105,345(+0.08%)
2022-01-19
105,411(+0.06%)
2022-01-20
105,484(+0.07%)
2022-01-21
105,547(+0.06%)
2022-01-22
105,603(+0.05%)
2022-01-23
105,660(+0.05%)
2022-01-24
105,705(+0.04%)
2022-01-25
105,749(+0.04%)
2022-01-26
105,811(+0.06%)
2022-01-27
105,875(+0.06%)
2022-01-28
105,934(+0.06%)
2022-01-29
106,015(+0.08%)
2022-01-30
106,073(+0.05%)
2022-01-31
106,139(+0.06%)
From 10 February 2020 onwards, the data includes the cases in Hubei that were not tested for the virus but clinically diagnosed based on medical imaging showing signs of pneumonia. [16]
The lab-tested data was also separately available for 10–15 February 2020. [17]
Data from 16 February 2020 onwards did not include a separate number of lab-tested cases.
From 19 February 2020 onwards, only new lab-tested cases were counted towards the total (but clinically diagnosed cases counted earlier were not discarded). [18]
On 17 April 2020, following the Wuhan government's issuance of a report on accounting for COVID-19 deaths that occurred at home that went previously unreported, as well as the subtraction of deaths that were previously double-counted by different hospitals, the NHC revised their cumulative totals dating to 16 April, adding 325 cumulative cases and 1,290 deaths. [19]
Data sourced from NHC daily reports. (In another link before January 25, on Wuhan MHC website before January 10)
  1. The 02-10 and 02-11 clinically diagnosed data has been based on appendix in the 02-11 Hubei WJW data, with 02-10's data obtained from deducting the number of new C.D. cases on that day from the total.
  2. The 02-12 data has been corrected based on the 02-13 NHC subtraction data and corresponding 02-13 Hubei data.
  3. The 02-18 number of tested cases is calculated based on the 02-19 subtraction data.
  4. Data from 02-19 excludes clinical diagnoses, so the calculation is made provisionally for ease of understanding the progression of the situation.
COVID-19-Pandemie - CN (China) - Infizierte (800px).svg
Cases
COVID-19-Pandemie - CN (China) - Tote (800px).svg
Deaths

Charts

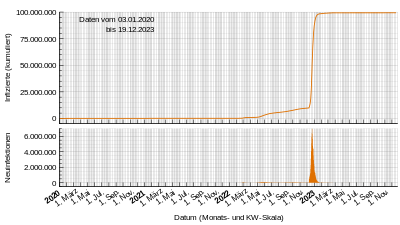
2020 cumulative and daily cases graph
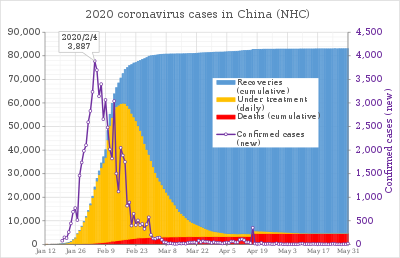
Data is from the Chinese National Health Commission.

2020 coronavirus patients in China.svg

New cases per day

Deaths per day

Recoveries per day

By province

Map of total Covid-19 cases across Chinese provinces between 2020-01-23 and 2022-06-01 Covid-19 cases across Chinese provinces.png
Map of total Covid-19 cases across Chinese provinces between 2020-01-23 and 2022-06-01
COVID-19 pandemic in mainland China by provinces
Data released by Chinese provinces as of 24:00 (UTC+8) 5 July 2021 [20] [21]
Chinese provincesPop. (mil.)
(2019)
CasesDeathsFatalityRecov.ActiveCases
/1M pop
Deaths
/1M pop
Ref.
China (mainland) 1,400.050086,3384,6345.3781,31938561.673.31 [22] [21]
Hubei 59.270068,1484,5126.6263,62791,149.876.13 [23] [21]
——Wuhan, Hubei11.212050,3403,8697.6946,47104,489.8345.08 [23]
Guangdong 115.21001,96380.411,9223317.00.07 [24] [21]
Zhejiang 58.50001,29110.081,2791122.10.02 [25] [21]
Henan 96.40001,288221.711,259713.40.23 [21]
Shanghai 24.28141,27770.551,1749652.60.29 [21]
Hunan 69.18381,02040.391,015114.70.06 [21]
Anhui 63.659099260.60985115.60.09 [21]
Xinjiang 25.232298030.319522538.80.12 [21]
Heilongjiang 37.5130949131.37936025.30.35 [21]
Jiangxi 46.661093510.11934020.00.02 [21]
Beijing 21.536094790.95932644.00.42 [26] [21]
Shandong 100.702184870.8384108.40.07 [21]
Sichuan 83.750078330.38735459.30.04 [21]
Jiangsu 80.700067600666108.40 [21]
Chongqing 31.243258961.02582118.90.19 [21]
Shaanxi 38.762148430.624384312.50.08 [21]
Fujian 39.730046110.224233711.60.03 [21]
Hebei 75.919737361.6136254.90.08 [21]
Inner Mongolia 25.396030710.332822412.10.04 [21]
Tianjin 15.618328931.042662018.50.19 [21]
Liaoning 43.517028820.6928066.60.05 [21]
Guangxi 49.600026020.7725805.20.04 [21]
Shanxi 37.29222180021355.80 [21]
Yunnan 48.583021720.9220964.50.04 [21]
Hainan 9.447217163.51165018.10.64 [21]
Gansu 26.474318121.1017726.80.08 [21]
Jilin 26.907315721.2715505.80.07 [21]
Guizhou 36.229514721.3614504.10.06 [21]
Ningxia 6.9466750075010.80 [21]
Qinghai 6.078218001802.960 [21]
Tibet 3.5056100100.290 [21]

By city

China edcp location map.svg
Location dot green.svg
Ili
2019–21 coronavirus pandemic by mainland Chinese city/prefecture [27] [28] [29] [30] ()

Hold cursor Pointing hand cursor vector.svg over location to display name; click to go to location article.


Location dot green.svg No active cases Location dot red.svg Confirmed Location dot orange.svg Imported [lower-alpha 1] Purple 8000ff pog.svg First outbreak of pandemic (no active cases)

As of 5 July 2021, there have been 2951 total (200 active) imported cases in mainland China, with no deaths recorded among them: [31]


See "Notes" section below for imported cases details (all data are given out of total imported cases).

Economic Performance

Comparison of Economic Indicators of China, India, Japan and the US during the Time of the Covid-19 Pandemic Economic developemnt of China, India, Japan and the US during Covid.png
Comparison of Economic Indicators of China, India, Japan and the US during the Time of the Covid-19 Pandemic

Notes

  1. Cities under "Imported" category has only active cases that are imported from outside Mainland China. In other words, there are currently no active local cases in these cities.
  2. FJ: 33 in Fuzhou, 61 in Xiamen, 22 in Quanzhou, 1 in Zhangzhou, 1 in Ningde; 104 additional recovered: Specific location to be clarified.
  3. GD: 25 (active) in Guangzhou, 3 (active) in Zhanjiang, 1 (active) in Foshan; 4 additional recovered: Specific location to be clarified.
  4. GX: Specific location not differentiated.
  5. HE: Specific location not differentiated.
  6. HA: Specific location not differentiated.
  7. NM: Specific location not differentiated.
  8. JX: 2 in Nanchang
  9. JL: 4 (0 active) in Changchun, 1 (0 active) in Meihekou, 12 (3 active) in Jilin City, 2 (0 active) in Yanbian
  10. SC: 21 in Chengdu

Related Research Articles

<span class="mw-page-title-main">COVID-19 pandemic in Shanghai</span> Ongoing COVID-19 viral pandemic in Shanghai

The COVID-19 pandemic in Shanghai is a part of the worldwide pandemic of coronavirus disease 2019 (COVID-19) caused by severe acute respiratory syndrome coronavirus 2 (SARS-CoV-2). The disease was first confirmed in Shanghai on 20 January 2020. As of 14 October 2022, 65,641 confirmed cases cumulatively occurred in the city, of which 3,045 cases were imported from abroad. Of the 96 active hospitalized cases ending at midnight, 94 were in stable condition and 1 was in critical condition; 61,600 had cumulatively recovered and been discharged, and 595 died.

The COVID-19 pandemic reached the province of Henan, China on 21 January 2020.

The COVID-19 pandemic reached the province of Sichuan, People's Republic of China on 20 January 2020, with its first case confirmed on the next day.

This article documents the situation of the COVID-19 pandemic in Inner Mongolia, the People's Republic of China.

The COVID-19 epidemic in Xinjiang Uyghur Autonomous Region is part of the worldwide pandemic of coronavirus disease 2019 (COVID-19) caused by severe acute respiratory syndrome coronavirus 2 (SARS-CoV-2). On 23 January 2020, the local government confirmed the first two case in Urumchi, the capital city of Xinjiang.

This article documents the situation of the COVID-19 pandemic in Liaoning Province, People's Republic of China.

This article documents the situation of the COVID-19 pandemic in the province of Heilongjiang, China. The first confirmed COVID-19 case in the province occurred in Mudanjiang on 21 January 2020, and though confirmed COVID-19 cases had begun to plateau by early March, by late March, international arrivals, largely from the neighboring Russian Far East, had added hundreds of cases to the province's total, leading to measures such as closed community management (封闭管理) in Suifenhe on 8 April.

<span class="mw-page-title-main">COVID-19 pandemic in Beijing</span> Ongoing COVID-19 viral pandemic in Beijing

The COVID-19 pandemic in Beijing is part of the worldwide pandemic of the coronavirus disease 2019 (COVID-19), caused by the severe acute respiratory syndrome coronavirus 2 (SARS-CoV-2). The disease first reached Beijing on 20 January 2020.

<span class="mw-page-title-main">COVID-19 vaccination in mainland China</span> Plan to immunize against COVID-19

COVID-19 vaccination in mainland China is an ongoing immunization campaign against severe acute respiratory syndrome coronavirus 2 (SARS-CoV-2) in mainland China, in response to the ongoing pandemic in the region.

<span class="mw-page-title-main">2022 Shanghai COVID-19 outbreak</span> COVID-19 viral outbreak in Shanghai in 2022

A COVID-19 outbreak in the city of Shanghai, China began on February 28, 2022, and ended on August 7, 2022. The outbreak was caused by the Omicron variant and became the most widespread in Shanghai since the pandemic began two years prior. Authorities responded with mass COVID-19 testing and a strict lockdown of the city in an effort to uphold China's zero-COVID policy; the latter marked the largest one in the country since the lockdown of Hubei in early 2020. The outbreak caused substantial economic and social disruption across Shanghai with consequences felt elsewhere, and led to the spread of COVID-19 to other parts of China, including Beijing, Guangdong, and Hunan.

The COVID-19 pandemic reached the province of Fujian, China, on January 22, 2020.

The COVID-19 pandemic reached the province of Zhejiang, China.

The COVID-19 pandemic reached the province of Shandong, China.

The COVID-19 pandemic reached the province of Hebei, China.

The COVID-19 pandemic reached the province of Shaanxi, China.

The COVID-19 pandemic reached the province of Jiangxi, China.

The COVID-19 pandemic reached the province of Hunan, China.

The COVID-19 pandemic reached the province of Anhui, China, in 2020.

The COVID-19 pandemic reached the Ningxia Hui Autonomous Region, China in 2020.

The COVID-19 pandemic reached the municipality of Tianjin, China, in January 2020.

References

  1. 新型冠状病毒肺炎流行病学特征分析. 中华流行病学杂志 (in Chinese). 41 (2): 145–151. n.d.
  2. "Live news from March 29: Russia says it will ease military activities in Kyiv, EU states expel Russian diplomats". Financial Times. 29 March 2022. Retrieved 7 April 2022. Chinese official data counts "asymptomatic" cases, when an individual tests positive for the virus, separately from "confirmed" cases, where infected individuals have their symptoms verified through medical observation.
  3. "Coronavirus Live Updates: Olympics Postponed; New York City Braces for a Deluge of Patients". The New York Times. 24 March 2020. Retrieved 24 March 2020.
  4. "A third of virus cases may be 'silent carriers', classified data suggests". South China Morning Post. 22 March 2020. Retrieved 24 March 2020.
  5. Kuo, Lily (23 March 2020). "Life after lockdown: has China really beaten coronavirus?". The Guardian. Retrieved 24 March 2020.
  6. "湖北省武汉市新冠肺炎疫情数据订正情况" [Revision of the data of the new coronary pneumonia epidemic situation in Wuhan City, Hubei Province] (in Chinese (China)). National Health Commission. 17 April 2020. Retrieved 2 June 2020.
  7. Wallace, Jeremy (11 December 2020). "Numbers Aren't Reality, but You Can't Govern Without Them". Foreign Policy. Retrieved 2021-03-28.
  8. Au, Lavender (2020-11-19). "How China crushed coronavirus". Wired UK. ISSN   1357-0978 . Retrieved 2021-03-28.
  9. Myers, Steven Lee; Bradsher, Keith; Wee, Sui-Lee; Buckley, Chris (2021-02-05). "Power, Patriotism and 1.4 Billion People: How China Beat the Virus and Roared Back". The New York Times. ISSN   0362-4331 . Retrieved 2021-03-28.
  10. Yu, Verna (20 December 2022). "China changes definition of Covid deaths as cases surge". The Guardian . Archived from the original on 22 December 2022. Retrieved 22 December 2022.
  11. Bradsher, Keith; Chien, Amy Chang; Dong, Joy (2022-12-23). "As Cases Explode, China's Low Covid Death Toll Convinces No One". The New York Times . ISSN   0362-4331 . Retrieved 2022-12-23.
  12. "China's low covid death count is being criticized as implausible". The Washington Post . 20 December 2022. Retrieved 23 December 2022.
  13. "Chinese city seeing half a million Covid cases a day – local health chief". The Guardian . Agence France-Presse. 24 December 2022. Retrieved 24 December 2022.
  14. Griffiths, Robbie (2022-12-25). "China has stopped publishing daily COVID data amid reports of a huge spike in cases". NPR . Retrieved 2022-12-25.
  15. "China data 'under-represents' true impact of Covid outbreak – WHO". The Guardian . 2023-01-04. Retrieved 2023-01-05.
  16. 国家卫生健康委员会办公厅 (5 February 2020). 新型冠状病毒感染肺炎的诊疗方案(试行第五版) (PDF). 国家卫生健康委员会办公厅 (in Chinese (China)). Archived (PDF) from the original on 5 February 2020. Retrieved 5 February 2020.
  17. 2020年2月11日湖北省新型冠状病毒肺炎疫情情况 (in Chinese (China)).
  18. Woodyatt, Amy; Kottasová, Ivana; Griffiths, James; Regan, Helen. "China changed how it counts coronavirus cases again. Here's why". CNN.
  19. 湖北省武汉市新冠肺炎疫情数据订正情况. National Health Commission. 2020-04-17. Retrieved 2020-04-17.
  20. 截至11月14日24时新型冠状病毒肺炎疫情最新情况 (in Chinese (China)). National Health Commission. 15 November 2020. Retrieved 15 November 2020.
  21. 1 2 3 4 5 6 7 8 9 10 11 12 13 14 15 16 17 18 19 20 21 22 23 24 25 26 27 28 29 30 31 32 33 新型冠状病毒肺炎疫情实时大数据报告. baidu.com (in Chinese). Retrieved 15 November 2020.
  22. 疫情通报. National Health Commission of PR China (in Chinese). Retrieved 15 November 2020.
  23. 1 2 2020年6月22日湖北省新冠肺炎疫情情况. hubei.gov.cn (in Chinese). Retrieved 27 July 2020.
  24. 2020年7月27日广东省新冠肺炎疫情情况 (in Chinese). Retrieved 27 July 2020.
  25. 2020年7月16日浙江省新型冠状病毒肺炎疫情情况 (in Chinese). Retrieved 27 July 2020.
  26. 2020年7月16日北京市新型冠状病毒肺炎疫情情况 (in Chinese). Retrieved 27 July 2020.
  27. "2019-nCoV Global Cases". gisanddata.maps.arcgis.com/. Retrieved 30 January 2020.
  28. 全球新冠病毒最新实时疫情地图_丁香园 (in Chinese). Retrieved 8 Oct 2020.
  29. 疫情通报(列表). nhc.gov.cn (in Chinese). Retrieved 2 March 2020.; current information about the 2020 coronavirus outbreak in Chinese provinces, other countries in the globe, see 疫情实时大数据报告. baidu.com (in Chinese). Retrieved 2 March 2020.
  30. 新冠肺炎疫情动态 (in Chinese). Retrieved 8 Oct 2020.
  31. 截至10月7日24时新型冠状病毒肺炎疫情最新情况 (in Chinese (China)). National Health Commission. 8 Oct 2020. Retrieved 8 Oct 2020. 境外输入现有确诊病例200例(其中重症病例1例),现有疑似病例5例。累计确诊病例2951例,累计治愈出院病例2751例,无死亡病例。
  32. 安徽疫情地图. feiyan.wecity.qq.com. Retrieved 2020-10-08. 累计报告境外输入确诊病例1例,治愈出院1例
  33. 北京疫情地图. feiyan.wecity.qq.com. Retrieved 2020-10-08. 9月24日0时至24时,北京新增报告1例境外输入无症状感染者转确诊的病例。
  34. 重庆疫情地图. feiyan.wecity.qq.com. Retrieved 2020-10-08. 截至10月7日24时,重庆市现有境外输入在院确诊病例1例(为尼泊尔输入),累计治愈出院病例8例,累计报告境外输入确诊病例9例。
  35. 福建疫情地图. feiyan.wecity.qq.com. Retrieved 2020-10-08. 截至10月7日24时,福建省累计报告境外输入确诊病例118例,已治愈出院104例,目前住院14例,无死亡病例
  36. 甘肃疫情地图. feiyan.wecity.qq.com. Retrieved 2020-10-08. 甘肃无新增境外输入性新冠肺炎确诊病例
  37. 广东疫情地图. feiyan.wecity.qq.com. Retrieved 2020-10-08. 截至10月7日24时,全省累计报告新冠肺炎确诊病例1848例(境外输入452例)。目前在院25例。
  38. 广西疫情地图. feiyan.wecity.qq.com. Retrieved 2020-10-08. 全区现有境外输入确诊病例3例
  39. 贵州疫情地图. feiyan.wecity.qq.com. Retrieved 2020-10-08. 截至10月7日24时,贵州省累计报告本地确诊病例146例、境外输入病例1例,累计治愈出院病例145例、死亡病例2例,现有疑似病例0例、无症状感染者0例。
  40. 河北疫情地图. feiyan.wecity.qq.com. Retrieved 2020-10-08. 截至10月7日24时,河北省现有确诊病例1例(境外输入),累计治愈出院病例358例(含境外输入25例),累计死亡病例6例,累计报告本地确诊病例339例、境外输入病例26例。
  41. 黑龙江疫情地图. feiyan.wecity.qq.com. Retrieved 2020-10-08. 2020年10月7日0-24时,黑龙江省无新冠肺炎疫情报告。
  42. 河南疫情地图. feiyan.wecity.qq.com. Retrieved 2020-10-08. 累计报告境外输入确诊病例8例,4例出院,4例正在定点医院接受治疗。
  43. 湖南疫情地图. feiyan.wecity.qq.com. Retrieved 2020-10-08. 截至10月7日24时,湖南省累计报告新型冠状病毒肺炎确诊病例1019例,死亡病例4例,出院病例1015例。
  44. 内蒙古疫情地图. feiyan.wecity.qq.com. Retrieved 2020-10-08. 截至2020年10月8日7时,现有境外输入确诊病例6例,均在定点医院隔离治疗,所有密切接触者均在指定场所进行集中隔离医学观察,全程实行闭环管理,严防疫情扩散蔓延。
  45. 江苏疫情地图. feiyan.wecity.qq.com. Retrieved 2020-05-13. 截至5月12日24时,累计报告境外输入确诊病例22例,均已出院。
  46. 江西疫情地图. feiyan.wecity.qq.com. Retrieved 2020-04-12. 截至4月11日24时,全省累计报告境外输入确诊病例2例,累计出院病例2例,无住院确诊病例。
  47. 吉林疫情地图. feiyan.wecity.qq.com. Retrieved 2020-05-13. 截至5月12日24时,全省累计报告境外输入确诊病例19例,累计治愈出院16例(吉林市9例,延边州2例,长春市4例,梅河口市1例),在院隔离治疗3例(吉林市3例)。
  48. 辽宁疫情地图. feiyan.wecity.qq.com. Retrieved 2020-05-13. 5月12日0时至24时,辽宁省无新增新冠肺炎确诊病例,无新增治愈出院病例。 全省累计报告境外输入确诊病例21例,全部治愈出院。
  49. 陕西疫情地图. feiyan.wecity.qq.com. Retrieved 2020-05-13. 截至5月13日8时,陕西累计报告境外输入新冠肺炎确诊病例63例(治愈出院55例,无死亡病例),现有8例。
  50. 山东疫情地图. feiyan.wecity.qq.com. Retrieved 2020-05-13. 累计报告境外输入确诊病例25例。无新增治愈出院病例,累计治愈出院23例。
  51. 上海疫情地图. feiyan.wecity.qq.com. Retrieved 2020-05-13. 截至5月12日24时,累计报告境外输入性确诊病例321例,治愈出院299例,在院治疗22例(其中1例危重、1例重症)。
  52. 山西疫情地图. feiyan.wecity.qq.com. Retrieved 2020-05-13. 累计报告境外输入性确诊病例64例,治愈出院64例。
  53. 四川疫情地图. feiyan.wecity.qq.com. Retrieved 2020-05-13. 截至5月13日0时,全省累计报告新型冠状病毒肺炎确诊病例561例(其中境外输入21例),累计治愈出院558例,死亡3例。
  54. 天津疫情地图. feiyan.wecity.qq.com. Retrieved 2020-05-13. 截至5月12日24时,天津市累计报告境外输入性新型冠状病毒肺炎确诊病例55例,出院病例53例,在院2例(均为普通型)。
  55. 云南疫情地图. feiyan.wecity.qq.com. Retrieved 2020-05-13. 截至5月12日24时,累计境外输入确诊病例11例,全部治愈出院。
  56. 浙江疫情地图. feiyan.wecity.qq.com. Retrieved 2020-05-13. 截至5月12日24时,累计报告境外输入确诊病例50例,累计出院50例。